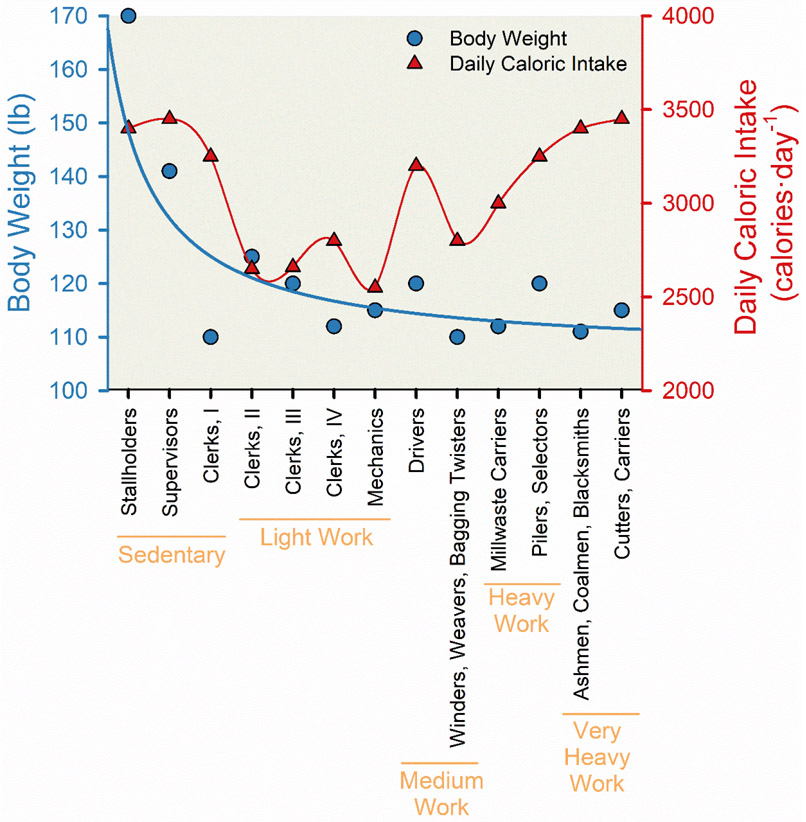
Figure 6. Association between occupational physical activity and both body weight and daily caloric intake.
Line charts displaying the reduction in body weight (blue circles and line) and “U-shaped” relationship in daily caloric intake (red triangles and line) with greater occupational physical activity among 213 employees of a jute processing plant in West Bengal, India. In this natural experiment conducted in the 1950s, food intake was assessed via dietary interviews, weight was measured using portable scales, and occupational physical activity was stratified into broad activity-based categories using both oxygen consumption and surveys to assess physical demand associated with occupation. Categories of occupational physical activity listed from least to most activity included: sedentary work (stallholders, supervisors, and clerks I), light work (clerks II, clerks III, clerks IV, and mechanics), medium work (drivers, winders, weavers, and bagging twisters), heavy work (millwaste carriers, pilers, and selectors), and very heavy work (ashmen, coalmen, blacksmiths, cutters, and carriers). Adapted from Mayer et al (231).

