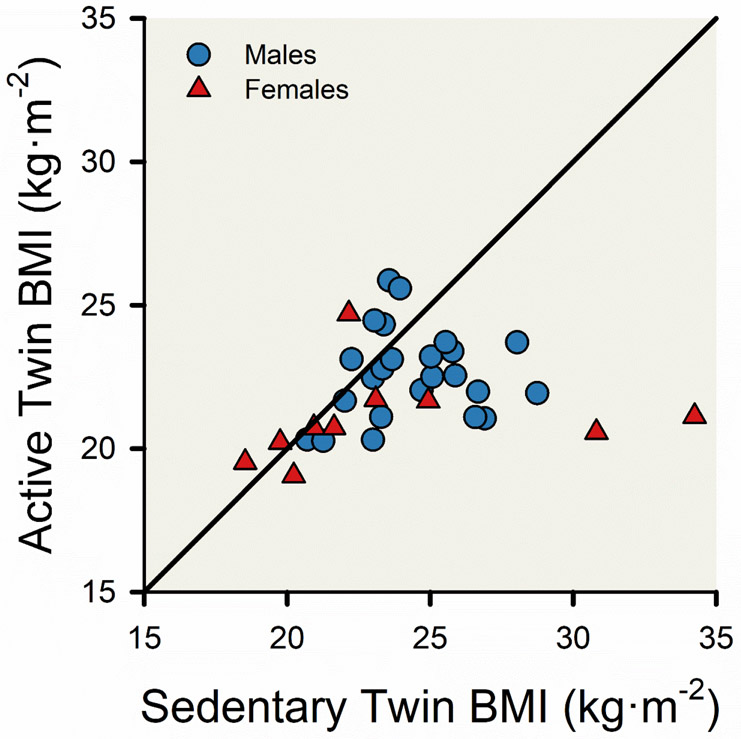
Figure 7. Null association between body mass index (BMI) of active and sedentary monozygotic twins.
The scatter plot displays the BMI of 10 pairs of female twins (red triangles) and 25 pairs of male twins (blue circles). The monozygotic twins were identified using data from the National Runners’ Health Study (372, 373), and the active twin is defined as running more weekly miles than the sedentary twin by at least 25 weekly miles for males and 20 weekly miles for females. The black line represents the line of equality and a hypothetical line depicting identical BMI values between pairs of twins. Adapted from Williams et al 2005 (374).

