

SUMMARY
The interplay between metabolism and chromatin signaling is implicated in cancer progression. However, whether and how metabolic reprogramming in tumors generates chromatin vulnerabilities remain unclear. Lung adenocarcinoma (LUAD) tumors frequently harbor aberrant activation of the NRF2 antioxidant pathway, which drives aggressive and chemo-resistant disease. Using a chromatin-focused CRISPR screen, we report that NRF2 activation sensitizes LUAD cells to genetic and chemical inhibition of class I histone deacetylases (HDACs). This association is observed across cultured cells, mouse models, and patient-derived xenografts. Integrative epigenomic, transcriptomic, and metabolomic analysis demonstrates that HDAC inhibition causes widespread redistribution of H4ac and its reader protein, which transcriptionally downregulates metabolic enzymes. This results in reduced flux into amino acid metabolism and de novo nucleotide synthesis pathways that are preferentially required for the survival of NRF2-active cancer cells. Together, our findings suggest NRF2 activation as a potential biomarker for effective repurposing of HDAC inhibitors to treat solid tumors.
Graphical Abstract

In brief
Abnormal activation of the NRF2 antioxidant response pathway in lung cancer drives aggressive and chemo-resistant disease. Karagiannis et al. report that inhibition of histone deacetylases has an antiproliferative effect in this cancer context through extensive changes in chromatin, metabolic gene expression, and suppression of amino acid and nucleotide metabolic pathways.
INTRODUCTION
Eukaryotic cells have evolved sophisticated mechanisms to sense and integrate extracellular information into an intrinsic signaling system that regulates transcription so that environmental fluctuations can be delivered and responded to in a timely and accurate manner. A key player in the process is chromatin, as many chromatin-modifying reactions require not only the proteinaceous enzymes but also small-molecule substrates/co-factors that are intermediates of central carbon metabolism. Indeed, it has been well documented that chemical modifications of DNA and histones can act as sensors for fluctuations in cellular metabolic flux and in turn mediate the transcriptional response to maintain metabolic homeostasis.1 Importantly, we and others have reported that these mechanisms can be hijacked by cancer cells to reprogram gene expression and facilitate tumor progression.2–4 It is less clear, however, if distinct metabolic abnormalities also render cancer cells vulnerable to perturbations of chromatin regulatory mechanisms. As a result, the therapeutic potential of targeting the crosstalk between chromatin and metabolism remains underexplored.
Nearly 20% lung adenocarcinoma (LUAD) tumors carry loss-of-function mutations in KEAP1 or gain-of-function mutations in NFE2L2 genes, both of which lead to activation of the NRF2 antioxidant response pathway.5 Activation of this pathway conveys several tumor-promoting properties to cells, including an increase in anabolic processes and production of antioxidant and detoxifying enzymes.5–7 These effects promote aggressive disease and drug resistance, which makes NRF2-active tumors particularly hard to treat. Aberrant NRF2 activation also occurs in other cancer contexts, such as head and neck squamous cell carcinoma and hepatocellular carcinoma, through genetic and non-genetic mechanisms.8,9 It has been reported that metabolic reprogramming upon NRF2 activation confers sensitivity to glutaminase inhibition.10,11 However, the KEAPSAKE clinical trial (ClinicalTrials.gov: NCT04265534), which evaluated the efficacy of glutaminase inhibitor CB-839 in patients with KEAP1 mutation, was discontinued due to lack of clinical benefit. As a result, identifying selective vulnerabilities of NRF2-active cancers that can be exploited for more effective treatment remains a key challenge.
Similar to many cancer-associated metabolic alterations, previous reports have linked NRF2 activation to dysregulated chromatin state.12,13 However, little is known about the underlying mechanisms and their importance for therapy. In this study, we sought to test if metabolic reprogramming by NRF2 activation confers potential chromatin-based vulnerabilities. Through a chromatin-focused CRISPR-Cas9 genetic screen, we uncovered an NRF2-driven sensitivity to class I histone deacetylase (HDAC) inhibition and defined the underlying molecular basis using integrative epigenomic, transcriptomic, and metabolomic analysis. Our findings suggest that cancer cells harboring metabolic alterations may exhibit strong and specific dependencies on chromatin regulators that can be therapeutically exploited and highlight the potential of combinatorial targeting of metabolism and chromatin–two emerging and intimately linked cancer molecular hallmarks.
RESULTS
NRF2 activation confers preferential vulnerability to loss of class I HDACs
To model and study NRF2 activation in LUAD, we used mouse LUAD cell lines derived from tumors generated through a genetically engineered mouse model (GEMM) of KrasG12D/+;p53−/−-driven LUAD. This system also enables CRISPR-Cas9-mediated knockout (KO) of a gene of interest such as Keap1.14 As previously described, KrasG12D/+;p53−/− (KP) and KrasG12D/+;p53−/−;Keap1−/− (KPK) tumors were generated using single guide RNAs (sgRNAs) against tdTomato (non-targeting control) or Keap1, respectively.10 Thus, KPK cell lines represent tumor-derived cells with a constitutively activated NRF2 pathway, and KP cell lines serve as control cells with normal NRF2 activity.
To identify novel chromatin vulnerabilities associated with NRF2 activation, we performed a targeted CRISPR-Cas9 genetic screen. KP and KPK cells were infected with a pool of sgRNAs targeting 612 chromatin regulators15 and passaged for 14 population doublings (Figure 1A). To confirm the quality of the screen, we compared the gene effect scores determined in this screen with that from genome-wide CRISPR-Cas9 screens in non-small cell lung cancer (NSCLC) cell lines from the DepMap database16,17 and found strong correlation between the two datasets (Figure 1B). Genes more essential in the context of activated NRF2 were identified by comparing the decreases in the abundance of sgRNAs in KP vs. KPK cells over time (Table S1). Notably, among genes that were essential in KP, but not KPK, cells, the top hit was Ube2m (Figure S1A), which is known to interact with the KEAP1 and Cullin-RING ligase (CRL) E3 ligase complex, and thus served as a positive control in our screen. Analysis of significantly depleted genes revealed multiple differential dependencies, including genes encoding the class I HDACs Hdac1, Hdac2, and Hdac3, which were synthetically lethal with Keap1 loss (Figures 1C, 1D, and S1B). Consistent with this result, in a competition assay assessing the fitness of cell populations carrying various sgRNAs targeting HDAC genes, KPK cells were more sensitive than KP cells to the loss of HDAC1–3 (Figures 1E–1G). Notably, the effect of HDAC1/2 loss was less pronounced compared to HDAC3. This is possibly due to the reported functional redundancy between HDAC1 and HDAC2.18–20 Taken together, our results suggest that class I HDAC genes are preferentially required for KPK cell viability and represent candidate therapeutic targets in the context of NRF2 activation.
Figure 1. NRF2 activation confers preferential vulnerability to loss of class I HDACs.

(A) Schematic of chromatin-focused CRISPR-Cas9 genetic screen.
(B) Pearson correlation of gene Z score (KP cells t1 vs. t0) of focused CRISPR-Cas9 screen to gene effect score of NSCLC cell lines (n = 94) from CERES 21Q3 DepMap dataset.
(C and D) Scatterplot of genes ranked by beta score (KPK-KP) (C) and ontology analysis of genes more essential in KPK cells (D).
(E) Schematic of competition assay employed to validate hits from the CRIPSR screen.
(F and G) Competition assay in KP and KPK cells to CRISPR-Cas9-mediated KO of HDAC genes (2 cell lines, 2 sgRNA each; p value determined by t test) (F) and HDAC protein levels upon KO (G); short and long exposure of HDAC1 is indicated.
NRF2 activation confers HDAC inhibitor sensitivity
To further validate the genetic screen results and investigate the therapeutic potential, we used KP cells with or without overexpression of NRF2ΔNeh2, a gain-of-function truncated NRF2 mutant lacking the KEAP1 interacting domain21 (Figure 2A). NRF2ΔNeh2 robustly induced NRF2 activation in KP cells (henceforth referred to as NRF2 overexpression), as indicated by stabilization of NRF2 protein levels and induction of NRF2 target gene expression (Figures 2B and 2C). In Cas9-expressing cells carrying empty vector (EV) or an NRF2 overexpression construct, introduction of sgRNA targeting Hdac3 caused a significant decrease in cell fitness as determined by the competition assay (Figures S2A and S2B).
Figure 2. NRF2 activation confers HDAC inhibitor sensitivity.

(A) Schematic indicating domains of the NRF2ΔNeh2 overactive mutant isoform of NRF2 protein.
(B) NRF2 protein levels upon of overexpression of NRF2ΔNeh2 in KP cells (NRF2).
(C) Expression of NRF2 target genes in EV and NRF2 KP cells (relative to EV).
(D and E) Comparison of KP EV and NRF2 cells IC50s to various HDAC inhibitors derived from 3 day viability assays (mean of 3 replicates, error bars indicate 95% confidence interval).
(F) NRF2 protein levels of KP cells carrying doxycycline (dox)-inducible NRF2ΔNeh2 upon treatment with DMSO, KI696, or dox and of KPK cells overexpressing luciferase (LUC) or KEAP1.
(G) Viability assay of KP and KPK cells treated with the indicated concentrations for 5 days (images are cropped).
(H) Viability assay of KP cells treated with the indicated concentrations of romidepsin for 72 h.
(I and J) Growth of subcutaneous KP tumors in C57BL/6 mice treated with romidepsin or vehicle (I; two-way ANOVA statistical test) and tumor weight at the end of treatment (J; mean ± SEM, Mann-Whitney statistical test).
*p < 0.05; **p < 0.01; ***p < 0.001; ****p < 0.0001.
Next, we examined the effect of pharmacologic inhibition of HDACs on the viability of cells with activated NRF2. Consistent with the association between NRF2 activation and genetic dependency on class I HDACs, NRF2-overexpressing KP cells were more sensitive to several HDAC inhibitors with high specificity toward class I HDACs22 (Figure 2D). Notably, NRF2 activation did not alter sensitivity to pan-HDAC inhibitors (Figure 2E). Moreover, analysis of DepMap datasets indicated that KEAP1-mutant NSCLC cell lines were, on average, more sensitive to class I HDAC inhibitors compared to wild-type cell lines, albeit not significantly (Figure S2C), in contrast to pan-HDAC inhibitors (Figure S2D).
In further experiments, we focused on the FDA-approved class I HDAC inhibitor romidepsin.23 To ensure that this finding is not due to selective pressures of long-term NRF2 activation, we employed three additional experimental systems. To induce transient NRF2 activation, we either used KI696, a small molecule that disrupts the interaction between KEAP1 and NRF2, or a doxycycline (dox)-inducible system of NRF2ΔNeh2 overexpression (Figure 2F). Previous studies have shown that such transient inductions of NRF2 activation are sufficient to recapitulate metabolic features of long-term activation, including hypersensitivity to glutaminase inhibition.10,11 In both cases, we observed increased sensitivity to romidepsin treatment comparable to that of long-term activation (Figures 2G, 2H, and S2F). Moreover, we overexpressed KEAP1 in KPK cells and observed reduced NRF2 protein levels and resistance to romidepsin (Figures 2F and 2G). Additionally, romidepsin significantly suppressed the in vivo growth of KP tumors overexpressing NRF2 but not control tumors (Figures 2I and 2J). Small interfering RNA (siRNA)-mediated silencing of Hdac3 in conjunction with romidepsin treatment indicated that the NRF2-specific effect of romidepsin is primarily mediated through Hdac3 inhibition (Figures S2G–S2I).
HDAC inhibition is associated with DNA damage and programmed cell death.24–26 To assess apoptosis and DNA damage levels, we measured phosphorylation of H2A.X (γH2AX) and cleaved caspase-3 upon romidepsin treatment at a concentration where NRF2-activated cells showed increased sensitivity (Figure S2J). Results indicate modest increases in DNA damage and apoptosis that were similar between EV and NRF2 cells, suggesting that the observed differences in romidepsin sensitivity are not due to increased DNA damage and/or apoptosis (Figure S2K).
Romidepsin alters gene expression by genomic redistribution of histone acetylation and BRD4
Class I HDACs are major regulators of histone acetylation. To investigate how HDAC inhibition affects histone acetylation to reprogram gene expression, we performed CUT&Tag27 upon romidepsin treatment to profile genomic distribution of the histone acetylation marks H3K27ac and H4ac (poly-acetylation on H4K5, H4K8, H4K12, and H4K16), as well as BRD4, a histone acetylation reader protein that activates gene transcription. Experiments were performed in duplicate with high correlation (r > 0.84) (Figure S3A). We also performed RNA sequencing and integrated the epigenomic datasets to correlate changes in histone acetylation landscape to differential gene expression.
HDAC inhibition with romidepsin induced broad gene expression changes including decreased expression of 1,692 genes (Figure 3A), which were highly concordant between control and NRF2-active cells (Figure S3B). In agreement, CUT&Tag of HDAC2 indicated similar genomic distribution between EV and NRF2 cells (Figures S3C and S3D), which suggests that class I HDAC localization is not affected by NRF2 activation.
Figure 3. Romidepsin alters gene expression by genomic redistribution of histone acetylation and BRD4.

(A) Volcano plot of differential gene expression upon romidepsin treatment (5 nM, 16 h) of KP NRF2 cells.
(B) Distribution of called H4ac and BRD4 peaks (n = 2) across genomic features.
(C) Heatmaps of histone acetylation signal at peaks that do or do not overlap with promoters (within 1.25 kb from a transcription start site [TSS]).
(D) Boxplots of read counts per million (CPM) at called peaks or random regions and illustrations indicating the ratio of signal at H4ac peaks (A) compared to background (random regions; B).
(E) Boxplots of read CPM at consensus peaks with low, medium, or high levels at DMSO treatment (peaks were ranked by CPM and split into thirds; one of two replicates is shown).
(F) Fold change expression (ROM/DMSO; DEseq2 analysis of RNA sequencing [RNA-seq]) of genes that gain, lose, or have no difference (ND) in promoter histone acetylation and/or BRD4 binding (cutoff: 1.5-fold change).
(G) Fold change expression (as in F) of genes with variable initial levels of H4ac and BRD4 binding (promoters were ranked by CPM and split into percentiles; average of two replicates is shown).
(H) Illustration of how HDAC inhibition can cause gene expression changes by displacement and diffusion of BRD4 due to global gain of H4ac.
All analyses shown are in KP NRF2 cells, and analyses in EV cells are equivalent.
Significance in (E) and (F) was determined by t test; ns, not significant; ****p < 0.0001.
As expected, romidepsin induced global increase in histone acetylation levels, while BRD4 levels were largely unchanged (Figure S3E). We first assessed how genome-wide histone acetylation and BRD4 distributions were affected by HDAC inhibition. We annotated genomic features of H4ac and BRD4 peaks and found that romidepsin induced a redistribution of peaks from promoters to distal intergenic regions (Figure 3B). Consistently, H4ac levels and BRD4 binding at promoter-associated peaks were reduced following romidepsin treatment (Figure 3C). Furthermore, we measured H4ac reads at peaks vs. random genomic regions and observed that upon romidepsin treatment, H4ac was reduced at peaks and increased in random regions (Figure 3D). Indeed, romidepsin treatment led to a >2-fold decrease in the ratio of H4ac peak signal over genome average (Figure 3D). Finally, we found that the initial levels of H4ac and BRD4 enrichment correlated with the degree of loss in H4ac and BRD4 binding following romidepsin treatment (Figures 3E and S3F). Together, these results suggest a model where HDAC inhibition alters the ratio between the abundance of H4ac at promoter-associated peaks and at distal intergenic regions, which in turn dilutes BRD4 binding at H4ac-high promoters.
Relative changes in histone acetylation, particularly H4ac, and BRD4 binding at gene promoters correlated strongly with changes in gene expression (Figure 3F). Consistently, genes with high levels of H4ac and BRD4 binding at promoters also showed the largest degree of decrease in expression following HDAC inhibition (Figure 3G). We also measured absolute (with spike-in normalization) changes in H3K27ac, H4ac, and BRD4 (Figures S3G and S3H). When adjusting the histone acetylation signal based on total abundance, there was increased histone acetylation associated with both upregulated and downregulated genes (Figure S3G), indicating poor correlation with gene expression changes. Therefore, the relative changes in H4ac appear to be a major driver of BRD4 re-targeting and transcriptomic changes.
Overall, these results suggest that romidepsin induces gene expression changes, primarily as a result of broad redistribution of H4ac and BRD4 binding. In particular, we find diffusion of H4 acetylation away from promoters and highly acetylated peaks. A previous report suggested that BRD4 distribution is affected similarly to relative H4ac changes, including displacement from gene promoters.28 Indeed, we found that genome-wide changes in BRD4 binding correlated well with H4ac changes and, to a lesser degree, with H3K27ac (Figure S3I). This suggests a model where HDAC inhibition induces redistribution of BRD4 driven by changes in relative H4ac levels and alters gene expression (Figure 3H).
Romidepsin regulates expression of genes that represent metabolic vulnerabilities of NRF2-active cells
Since romidepsin induced similar transcriptomic changes in control and NRF2-active cells (Figure S3B) but showed preferential toxicity toward NRF2-active cells, we reasoned that the differentially expressed genes could affect pathways that are more essential for NRF2-active cell viability. To explore this hypothesis, we first examined if known vulnerabilities associated with KEAP1 loss and NRF2 activation are transcriptionally regulated by romidepsin. It has been well documented that NRF2 activation is associated with a specific dependency on glutamine uptake and catabolism.10,11,29 In addition, NRF2 activation has been shown to promote serine and glycine biosynthesis and dependency.30,31 Therefore, we examined expression of genes involved in glutamine uptake32/metabolism and serine/glycine biosynthesis pathways (Figure S4A). We found that romidepsin induced downregulation of these genes in vitro (Figure 4A). Moreover, romidepsin treatment in vivo led to a reduction in protein levels of ATF4, a master transcriptional regulator of amino acid metabolism (Figures S4B and S4C). In contrast, we did not find consistent gene expression changes in glycolysis, TCA cycle, and NRF2 target genes (Figure 4A).
Figure 4. Romidepsin regulates expression of genes that represent metabolic vulnerabilities of NRF2-active cells.

(A) Heatmap showing expression of metabolic genes (RNA-seq; normalized by DEseq2 and scaled for each gene).
(B and C) Venn diagram showing overlap between genes downregulated by romidepsin (cutoff: 1.5-fold change and false discovery rate [FDR] < 0.05) in KP NRF2 cells and genes that are more essential in KEAP1-mutant NSCLC cell lines from the CERES DepMap dataset (cutoff: 0.05 gene effect difference) (B) and MsigDB Hallmark ontology of the overlapping genes (C).
(D) Competition assay showing fraction of RFP+ KP Cas9 cells after 14 population doublings, indicating percentage of cells that carry sgRNA against the indicated genes (n = 3; Sidak’s multiple comparisons test).
(E) Western blot showing levels of c-MYC upon romidepsin treatment of KP cells (5 nM for 16 h).
(F) Immunohistochemistry (IHC) staining of c-MYC and quantitation in KP NRF2 tumors after 17 days of treatment with DMSO or romidepsin (n = 4 tumor sections, Fisher’s least significant difference [LSD] statistical test; related to Figures 2I and 2J).
(G) Rank plot of gene promoter H4ac in KP NRF2 cells; top 10% genes with highest H4ac levels are noted in red.
(H) Bedgraphs of H4ac and BRD4 binding at indicated gene loci in KP NRF2 cells; equal results found in EV cells.
*p < 0.05; **p < 0.01.
We next analyzed the CERES genome-wide CRISPR screen dataset of human cell lines from the DepMap database.16,17 We identified genes that represent specific dependencies for KEAP1-mutant NSCLC cell lines and intersected them with the genes downregulated by romidepsin (Figure 4B; Tables S2, S3, and S4). Gene Ontology analysis revealed enrichment in MYC targets (Figure 4C), including Myc itself and its target genes involved in purine and pyrimidine synthesis (Figure S4D). Using a competitive cell proliferation assay, we confirmed that genetic KO of Myc and several de novo nucleotide synthesis genes was more detrimental to the survival of KP cells with NRF2 activation (Figures 4D and S4E). Furthermore, romidepsin reduced MYC protein levels in vitro and in vivo (Figures 4E, 4F, and S4F).
Taken together, these results suggest that class I HDAC inhibition induces downregulation of several metabolic genes that are more essential for the survival of cells with NRF2 activation. In agreement with this, CRISPR-Cas9-mediated KO of Hdac3 in KP cells led to downregulation of most of these metabolic genes (Figures S4G and S4H). Furthermore, several metabolic genes have high pre-existing levels of promoter H4ac (Figures 4G and 4H). Consistent with our global epigenomic analyses (Figures 3E and 3H), we found loss of H4ac and BRD4 binding at the promoters of these genes upon romidepsin treatment (Figures 4H and S4I). Overall, these findings suggest that the chromatin reprogramming induced by romidepsin leads to downregulation of genes involved in NRF2-specific metabolic vulnerabilities.
Romidepsin disrupts metabolic processes that are essential for NRF2-active cells
To examine how romidepsin-induced changes in metabolic gene expression affect metabolic flux, we performed isotope tracing analysis.33 KP cells with or without NRF2 activation were treated with DMSO, romidepsin, or the glutaminase inhibitor CB-839 for 24 hours and then cultured in 13C-glucose for 1 and 24 hours or in 13C-glutamine for 8 hours before harvesting (Figures 5A, 5B, S5A, and S5B). Glutamine tracing indicated that in romidepsintreated, but not CB-839-treated, cells, the proportion of 13C-labeled glutamine was reduced, indicating reduced glutamine uptake (Figure 5C). Consistent with this finding, media glutamine consumption was reduced upon romidepsin treatment (Figure S5C). Romidepsin treatment also reduced 13C incorporation into further steps of glutamine metabolism (Figure 5D; M+5 glutamate, M+3 αKG). Interestingly, in NRF2-active cells, romidepsin and CB-839 had a comparable effect on reducing glutamine-derived 13C incorporation into TCA cycle metabolites (Figure 5E; M+4 citrate, M+4 succinate, M+4 fumarate, M+4 malate). In addition, we found strongly reduced incorporation of glutamine carbon in pyrimidine nucleotides (Figure 5F; M+1, +2, and +3 UTP), which suggests a disruption of de novo nucleotide synthesis.
Figure 5. Romidepsin disrupts metabolic processes that are essential for NRF2-active cells.

(A) Schematic indicating glutamine metabolic processes, labeled glutamine carbon contribution (numbers indicate sequential TCA cycles), and genes that are downregulated upon romidepsin treatment (in red).
(B) Color indications of isotopologues.
(C–F) Bar graphs showing isotopologue percentages for the indicated metabolites after U-13C glutamine tracing for 8 h.
(G and H) Bar graphs showing isotopologue percentages for the indicated metabolites after U-13C glucose tracing for the indicated time.
While glycolysis has been reported to be suppressed by HDAC inhibition in other tumor models,34,35 we did not find this to be the case in our experimental system (Figures S5D and S5E), in agreement with our gene expression data (Figure 4A). However, we did find reduced incorporation of glucose-derived 13C in purine and pyrimidine nucleotides (Figure 5G; 1 h M+5 UTP, 24 h M+6 and +7 UTP, 1 h M+5 and +6 GTP, 24 h M+7, +8, and +9 GTP), again consistent with the gene expression results indicating reduced rate of de novo nucleotide synthesis. Moreover, we found reduced incorporation of glucose-derived 13C into serine, which suggests a possible defect in serine biosynthesis (Figure 5H; M+1, M+2, and M+3 Serine).
Overall, these metabolomic results suggest that romidepsin disrupts key metabolic processes (serine/glutamine metabolism and de novo nucleotide synthesis) that support viability of NRF2-active cells. Specifically, romidepsin disrupts glutamine flux into the TCA cycle in a similar manner to glutaminase inhibition, which underlies the NRF2-specific sensitivity to glutaminase inhibitor.11
Glutamine metabolism suppression partially underlies the NRF2-specific effect of romidepsin on cell growth
Our findings suggest that glutamine uptake and utilization is a major aspect of the NRF2-specific effect of romidepsin on cell metabolism. As a functional investigation, we overexpressed SLC1A5, an amino acid transporter with higher affinity for glutamine, in KP EV and NRF2 cells (Figure 6A). SLC1A5 overexpression did not affect expression of other metabolic genes or NRF2 pathway activation (Figures 6A and 6B). Importantly, SLC1A5 overexpression in KP NRF2 cells increased the IC50 of romidepsin to EV levels, with no significant effect observed in EV cells (Figures 6C and S6A). Similarly, romidepsin treatment had a significant effect on KP NRF2 tumor growth in vivo, which was abrogated in NRF2 tumors overexpressing SLC1A5 (Figure 6D). In contrast, EV tumors with and without SLC1A5 overexpression responded similarly to romidepsin (Figure 6E). These results suggest that the suppression of glutamine utilization at least partially mediates the NRF2-specific effect of romidepsin on cell viability.
Figure 6. Glutamine metabolism suppression partially underlies the NRF2-specific effect of romidepsin on cell growth.

(A) Expression of indicated genes in KP EV and NRF2 cells carrying empty vector (LVX) or SLC1A5 overexpression.
(B) Western blot indicating protein levels of NRF2 after SLC1A5 overexpression.
(C) Romidepsin IC50 of KP cells transduced with empty vector (LVX) or overexpressing SLC1A5 (mean of 3 replicates, error bars indicate 95% confidence interval). (D and E) Growth of subcutaneous KP EV and NRF2 tumors carrying empty vector (LVX) or SLC1A5 overexpression in C57BL/6 mice treated with romidepsin (statistical significance determined by two-way ANOVA).
(F) CRISPR-Cas9 focused screen scatterplot of genes ranked by beta score (KPK – KP) of cells treated with CB839 for 14 population doublings (as in Figure 1A).
(G and H) Weights of KP EV and NRF2 tumors treated in C57BL/6 mice as indicated for 2 weeks (mean ± SEM, Mann-Whitney statistical test).
*p < 0.05; **p < 0.01; ***p < 0.001; ****p < 0.0001.
Glutamine catabolism is a therapeutic target under intense investigation, including for NRF2-hyperactive lung cancers,10,29 but its efficacy is hindered by resistance mechanisms.36 To explore the potential synergy between HDAC and glutaminase inhibition, we performed another chromatin-focused CRISPR-Cas9 screen in the context of CB-839 treatment and found that Hdac3 remained as one of the top essential genes in KPK compared to KP cells (Figure 6F; Table S5). Next, we generated CB-839-resistant cell lines by treating NRF2-overexpressing cells with increasing doses of CB-839 up to 500 nM for 2 weeks (Figure S6B). Control and CB-839-resistant cells showed similar responses to romidepsin treatment in vitro (Figure S6C). In agreement with this notion, romidepsin showed comparable efficacy to CB-839 in the treatment of KP EV and NRF2 overexpression tumors (Figures 6G, 6H, S6D, and S6E). Interestingly, the combination of romidepsin and CB-839 (COMBO) resulted in improved tumor response compared to either treatment alone (Figures 6G, 6H, S6D, and S6E), without a significant effect on mouse weight (Figure S6F). Overall, these results suggest that romidepsin and CB-839 inhibit glutamine metabolism and tumor growth through distinct mechanisms, which provides the rationale for combined HDAC and glutaminase inhibition as treatment for NRF2-active cancer.
NRF2 activation confers sensitivity to HDAC inhibition in human cells and patient-derived xenografts (PDXs)
To test if the association between NRF2 activation and HDAC inhibitor sensitivity is conserved in human cells, we used the KEAP1-mutant LUAD cell line A549 and targeted NFE2L2 using the CRISPR-Cas9 system, which led to a partial reduction in NRF2 protein levels and NRF2 target gene expression (Figures 7A and 7B). Consistent with our findings in the murine cell lines, romidepsin suppressed expression of MYC, ATF4, and several genes involved in de novo nucleotide synthesis, glutamine transport, and serine synthesis (Figures 7C and 7D). In addition, siRNA-mediated silencing of HDAC3 in A549 cells led to the downregulation of several genes involved in glutamine uptake and de novo nucleotide and serine synthesis (Figure S7A). NRF2 wild-type (WT) A549 cells were more sensitive to romidepsin than NRF2 KO cells in vitro (Figure 7E) and in vivo (Figures 7F and S7B). Additionally, induction of NRF2 activation in the KEAP1 WT cell line NCI-H2009 by overexpression of KEAP1R470C, a dominant-negative mutant form of KEAP1,37 led to increased sensitivity to romidepsin (Figures S7C and S7D). In PDXs of KEAP1 WT or -mutant tumors, which were generated as previously described,10 romidepsin treatment caused earlier and stronger suppression of growth in NRF2-active tumors (Figures 7G, 7H, and S7E), as well as reduction in c-MYC levels (Figure S7F). Finally, A549 xenograft tumors were sensitive to the combination of romidepsin and CB-839 (Figures 7I and 7J). Collectively, these results show that the phenotype and mechanism of HDAC inhibition we described in murine LUAD can be extrapolated to human settings and provide pre-clinical evidence of romidepsin as a potential therapeutic for LUAD with NRF2 activation.
Figure 7. NRF2 activation confers sensitivity to HDAC inhibition in human cells and patient-derived xenografts (PDXs).
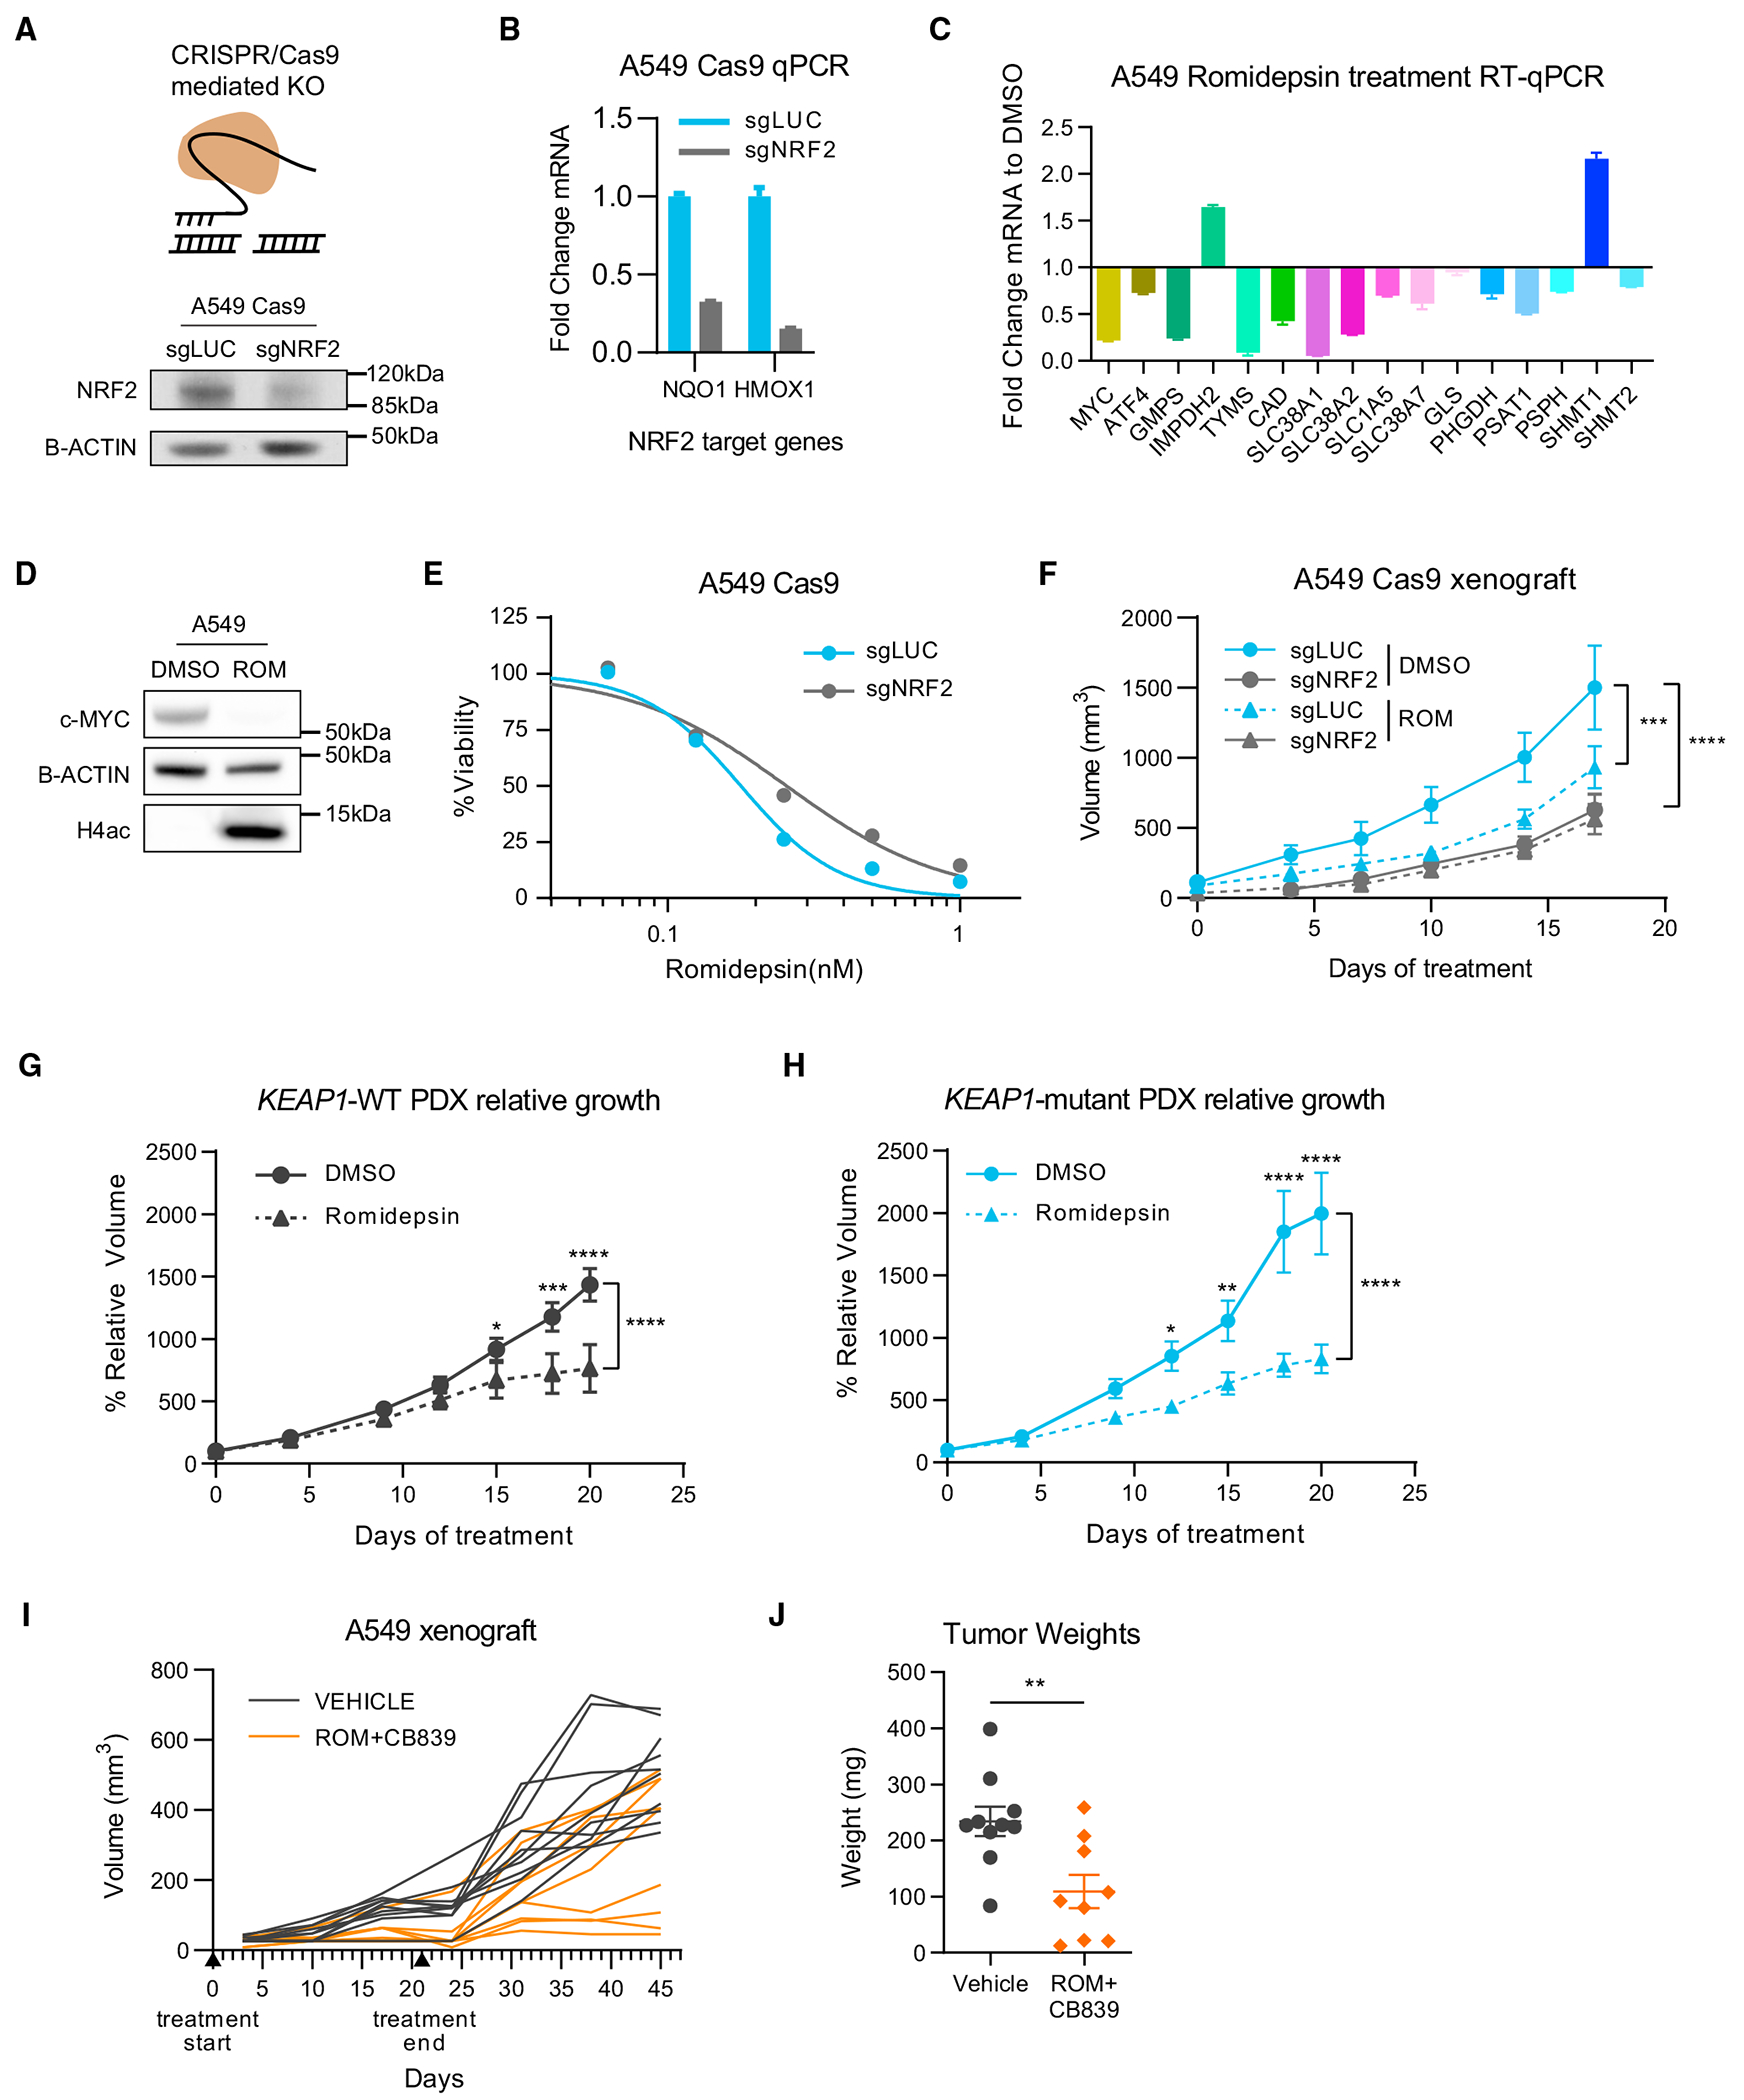
(A) Schematic of CRISPR-mediated KO and NRF2 protein levels upon NRF2 KO (sgNRF2) in a population of Cas9-expressing A549 cells compared to control (sgLUC).
(B) Fold change expression of NRF2 target genes upon NRF2 KO in A549 cells (relative to sgLUC; mean ± SEM).
(C) Fold change expression of indicated genes upon romidepsin treatment (5 nM for 16 h) of A549 cells determined by RT-qPCR (relative to DMSO; mean ± SEM).
(D) Western blot showing levels of c-MYC and H4ac upon romidepsin treatment of A549 cells.
(E) Viability assay of A549 cells treated with the indicated concentrations of romidepsin for 72 h.
(F) Growth of subcutaneous A549 tumors in nude mice treated with vehicle (DMSO) or romidepsin (statistical significance determined by two-way ANOVA).
(G and H) Relative growth curves of PDX tumors that are wild-type or mutant for KEAP1 treated with vehicle (DMSO) or romidepsin (statistical significance determined by two-way ANOVA).
(I and J) Long-term growth of A549 subcutaneous tumors treated with romidepsin/CB839 combination or vehicle (I) and tumor weights at endpoint (J; mean ± SEM, Mann-Whitney statistical test).
*p < 0.05; **p < 0.01; ***p < 0.001; ****p < 0.0001.
DISCUSSION
In this study, we used a focused CRISPR-Cas9 genetic screen to identify chromatin vulnerabilities driven by NRF2 activation in LUAD. We identified a preferential dependency on class I HDAC genes, which translated to increased sensitivity to the class I HDAC inhibitor romidepsin. Following HDAC inhibition, global hyperacetylation of the genome displaces transcription co-activators such as BRD4 from genes with high levels of histone acetylation, such as those involved in cell metabolism. As a result, we observed reduced rate of glutamine uptake/catabolism as well as de novo nucleotide and serine synthesis, which imposed selective metabolic stress on NRF2-active cancer cells, causing antitumor effects that can be observed in vitro and in vivo using human NSCLC cell lines and PDXs.
These pre-clinical findings have several mechanistic and translational implications. First, targeting of KEAP1/NRF2 alterations in cancer remains a key clinical priority. NRF2 hyperactivation promotes aggressive tumor growth and resistance to chemotherapy, radiation, and immunotherapy, leading to poor patient prognosis. A number of therapeutic strategies have been explored, including small molecules targeting NRF2 itself or its interaction with KEAP1,38,39 tumor immune-modulating agents,40,41 and inhibiting metabolic pathways as synthetic lethal events.10,11,31,42 In particular, inhibitors of glycolysis and glutaminolysis have shown promising effects in pre-clinical models,10,42,43 as NRF2 activation causes significant changes to central carbon and amino acid metabolism. Nevertheless, the glutaminase inhibitor CB-839 as monotherapy has shown limited success in treating KEAP1-mutant NSCLC in clinical trials. Our study suggests that repurposing the FDA-approved HDAC inhibitor romidepsin could represent another synthetic lethal approach to target NRF2-active tumors. Our in vivo study suggests that romidepsin has similar efficacy to CB-839 and that the combination of both inhibitors offers additional therapeutic effects. Moreover, our in vitro experiments suggest that romidepsin remains an effective treatment for cancer cells that have developed adaptive resistance to CB-839. These results provide strong pre-clinical rationale for evaluating romidepsin, alone or combined with CB-839, for treating NSCLC or other tumor types harboring a dysregulated KEAP1/NRF2 pathway. In addition to glutamine metabolism, our epigenome and transcriptome analysis also identified de novo nucleotide synthesis as a metabolic vulnerability of NRF2-active cancer cells, which was confirmed by metabolomic and functional studies. Future efforts are required to evaluate the efficacy of inhibiting nucleotide synthesis, such as inhibitors of dihydroorotate dehydrogenase (DHODH), in treating NRF2-hyperactive tumors.
Mechanistically, our multi-omics analysis revealed that the impact of romidepsin on histone acetylation, particularly tetraacetylated H4, is more complex than previously reported. Specifically, the genome-wide modest gain in diffuse H4ac signal drives a relative loss of H4ac at strong promoter peaks. This redistribution in H4ac was associated with concomitant changes in BRD4 binding and gene expression. These findings are in agreement with a recent report28 and suggest that the initial chromatin state can be predictive of the epigenetic (defined as chromatin structure and modifications that regulate genome accessibility) and transcriptional effects of HDAC inhibition. Transcriptomic and metabolomic analysis indicated that HDAC inhibition suppressed metabolic gene expression and activity in LUAD cells. Specifically, we found disruption of pathways that support viability and growth during NRF2 activation, including purine and pyrimidine synthesis, glutamine uptake and hydrolysis, serine synthesis, and the TCA cycle. The paradigm of metabolic gene expression modulation by epigenetic perturbation has been described in several other contexts, including KMT2D-deficient lung cancer,44 H3K27M-mutant glioma,45 and childhood posterior fossa group A ependymomas.46 In addition, dependency on transcriptional regulation of serine and nucleotide synthesis has been described in acute myeloid leukemia (AML).47 Future studies are warranted to investigate how chromatin abnormality can be hijacked by cancer cells to transcriptionally reprogram metabolism and if combined targeting of chromatin and metabolism represents an effective therapeutic strategy in additional settings.
Cancer-associated chromatin abnormality is emerging as a major target for therapeutic intervention, and specific and potent inhibitors of many chromatin-modifying enzymes have been developed.48 Nevertheless, only a handful of chromatin-targeted drugs have been approved to treat mainly hematologic malignancies, including HDAC inhibitors (romidepsin and vorinostat), which are used for treatment of refractory T cell lymphoma,49,50 as well as DNA methyltransferase inhibitors, which are used as first-line treatment of myeloid malignancies.51 In part, this gap reflects our limited understanding of the mechanisms of action and the lack of robust biomarkers for epigenetic therapies.52 Previous studies assessed the efficacy of HDAC inhibitors mainly through phenotypic observations, gene expression analysis, and analog-based drug discovery.53 As a result, their precise mechanism of cell killing is not well understood. Our findings indicate that romidepsin transcriptionally reprograms amino acid metabolism and de novo nucleotide synthesis, which renders selective toxicity to NRF2-active cancer cells. This is consistent with previous reports that HDAC inhibitors synergize with inhibitors of electron transport chain and fatty acid oxidation in glioblastoma.34 Moreover, disruption of metabolic pathways by HDAC inhibitors has been reported by several other groups.54–56 Taken together, these results suggest that metabolic alterations such as NRF2 hyperactivation could serve as effective biomarkers to predict the efficacy of HDAC inhibitors for treating solid tumors. We believe that similar concepts and strategies may be applicable to the identification of new biomarkers and broaden the number of patients with cancer who could benefit from other epigenetic drugs.
In summary, our findings provide the evidence and mechanistic basis for class I HDACs as potent and specific chromatin vulnerabilities of tumors with NRF2 activation. Moreover, they advocate retrospective or prospective studies on the NRF2 pathway as biomarkers to predict solid tumors’ response to HDAC inhibitors. We propose that the development of effective epigenetic therapies requires the rational design of pre-clinical studies and patient stratification that consider the interplay between the genetic, chromatin, and metabolic states of the cancer cell.
Limitations of the study
Our study has several limitations. Firstly, all experiments were performed in KRAS-mutant LUAD cell lines and tumors. Given that KRAS mutations has known roles in glutamine metabolism57,58 and sensitivity to HDAC inhibition,59 further study is warranted to assess if our findings can be extended to KRAS WT tumor cells. Secondly, SLC1A5 is an amino acid transporter that mediates uptake of glutamine but also other amino acids including serine.60,61 Further analysis is needed to elucidate the relative contributions of various metabolic pathways to NRF2-specific romidepsin sensitivity. Finally, we acknowledge that romidepsin causes significant and specific, but only partial, inhibition of growth of NRF2-active tumors. Further efforts are required to establish strong pre-clinical rationale for the use of HDAC inhibitors, alone or in combination (e.g., with standard chemo-/radiation therapy or glutaminase inhibitor), in the treatment of NRF2-active lung cancers.
STAR*METHODS
RESOURCE AVAILABILITY
Lead contact
Further information and requests for resources and reagents should be directed to and will be fulfilled by the Lead Contact, Chao Lu, PhD, cl3684@cumc.columbia.edu.
Materials availability
Plasmids and cell lines generated in this study are available upon request.
Data and code availability
All high throughput sequencing data included in this study are available in GEO accession number GSE220839. Metabolomics data are available in The Metabolomics Workbench Project: https://doi.org/10.21228/M84F0M. All other original data reported in this paper are available from the lead contact upon request.
This paper does not report original code.
Any additional information required to reanalyze the data reported in this work paper is available from the lead contact upon request.
EXPERIMENTAL MODEL AND STUDY PARTICIPANT DETAILS
Cell lines
KP and KPK cell lines were established in a previous study by the Papagiannakopoulos lab.10 For experiments outlined in Figures 1 and S1, two independent KP and two independent KPK cell lines were used. For all other experiments, KP and KPK cells refer to one of the two KP and KPK cell lines respectively and n refers to the number of experimental replicates. All cells were maintained in either DMEM or RPMI-1640 (Sigma-Aldrich) supplemented with 10% FBS (Sigma-Aldrich) and 1x Penicillin-Streptomycin (Sigma-Aldrich). Cells were incubated at 37° in 5% CO2 atmosphere. All cell lines were routinely tested for mycoplasma contamination. For antibiotic-based selection, puromycin (Sigma-Aldrich) was used at 5ug/ml, hygromycin (Sigma-Aldrich) at 500ug/ml and blasticidin (Sigma-Aldrich) at 5ug/ml. For fluorophore-based selection, cells were sorted by the Flow Cytometry Shared Resource at Columbia University using a BD Influx Cell Sorter.
Animal models
For KP and A549 in vivo studies, 6–8 weeks old male C57BL/6 mice (Cat# 000664) and Foxn1nu mice (Cat# 007850) were purchased from The Jackson Laboratory. All mice were housed under specific-pathogen-free (SPF) conditions and followed the guidelines of Columbia University animal facility. All mice experiments were carried out with the protocol approved by the Institutional Animal Care and Use Committee (IACUC) at Columbia University.
For the Patient-derived xenograft (PDX) experiment, the study was approved by the NYU Langone Medical Center Institutional Animal Care and Use Committee. Animals were housed according to IACUC guidelines in ventilated cages in a specific pathogen-free (SPF) animal facility. We used male and female littermates of NOD-scid IL2R gamma null (NSG) mice approximately 6–8 weeks in age.
METHOD DETAILS
Plasmid construction and Lentivirus production
Lentivirus were generated by transfecting 293T cells with the indicated expression plasmid and the psPAX2 (Addgene) and pVSVG62 (Addgene) packaging vectors at a ratio of 4:2:3, respectively. Viral supernatants were collected 48 and 72 h after transfection, filtered and used for transduction of cells in 1:1 ratio with medium. NRF2ΔNeh2, Keap1 (mouse and human), and KEAP1R470C overexpression constructs were generated by the Papagiannakopoulos lab. For CRISPR/Cas9 gene knock-out, we used the lentiCas9-blast plasmid63 (Addgene) and the pUSEPR vector for sgRNA (U6-sgRNA-EFS-Puro-P2A-TurboRFP in pLL3-based lentiviral backbone). For sgRNA design the CRISPick platform (BROAD institute) was used (Table S6). For SLC1A5 overexpression, cDNA was obtained from Addgene (Plasmid #71458) and cloned into pLVX-IRES-mCherry (Takara Bio).
sgRNA library
The gRNA library targeting murine chromatin regulators was constructed as previously described.15 Briefly, it consisted of sgRNA sequences (six per gene) targeting 612 mouse chromatin regulators that were designed using BROAD sgRNA Designer75 and 36 non-targeting control sgRNAs.15This library was synthesized by Agilent Technologies and cloned into the pUSEPR lentiviral vector to ensure a library representation of >10,000X using a modified version of a previously described protocol.75 Then, it was selectively amplified using barcoded forward and reverse primers that append cloning adapters at the 5 - and 3 -ends of the sgRNA insert, purified using the QIAquick PCR Purification Kit (Qiagen), and ligated into BsmBI-digested and dephosphorylated pUSEPR vector using high-concentration T4 DNA ligase (NEB). Ligated pUSEPR plasmid DNA was electroporated into Endura electrocompetent cells (Lucigen), recovered for 1 h at 37°C, plated across four 15cm LB-Carbenicillin plates (Teknova), and incubated at 37°C for 16 h. The total number of bacterial colonies was quantified to ensure a library representation of >10,000X. Bacterial colonies were scraped and briefly expanded for 4 h at 37°C in 500mL of LB-Carbenicillin. Plasmid DNA was isolated using the Plasmid Plus Maxi Kit (Qiagen).
Focused CRISPR/Cas9 screen
Derivatives of KP and KPK cells were generated by stable lentiviral transduction of Cas9 with blasticidin resistance (Addgene#52962). Cells were maintained with blasticidin selection throughout the experiment. Transduction of Cas9-expressing KP/KPK cells was performed at an MOI of approximately 0.2 by incubating cell suspension in lentiviral supernatant and centrifugation at 1500 rpm for 1.5 h at room temperature before being returned to a humidified incubator. An initial population was infected to represent a 2500x representation of the epigenetic library; 36 h post-transduction cells were resuspended and replated in 10 μg/mL puromycin and selected for another 48 h. After complete puromycin selection cells were trypsinized, pooled, a cell sample representing time-0hr (t0) of the screen was reserved and stored at −20°C. The remaining cells from each line were then passaged into Vehicle (Figures 1A–1D) or CB839 250nM (Figure 6I) conditions. CB839 treatment was initially started when cells had initially attached after initially being plated at a concentration of 125nM. This was then increased to 250nM and maintained constantly during the subsequent passage. Each condition was performed in technical triplicate for the entire screen and maintained in 15 cm tissue culture dishes (Corning) with at least 2500x library representation maintained throughout all culture and library preparation steps. Population doublings for each cell line and condition were recorded and a sample was collected when a particular condition had reached 14 cumulative population doublings and stored at −20°C.
Genomic DNA from collected cell pellets were prepared with purelink mini kit (ThermoFisher) according to the manufacturer’s suggested protocol. Amplification of 5ug gDNA equivalent was done as described previously15,76 and sequenced using an Illumina Next-seq 500 high output with 40% PhiX spike-in.
Computational analysis was done using MAGeCK.65 Briefly, the sequencing data were de-barcoded and the 20 bp sgRNA sequence was mapped to the reference sgRNA library without allowing for any mismatches. The read counts were calculated for each individual sgRNA and normalized, and differential analysis was done between KP and KPK samples. Quality control, gene hit identification and graphs were generated using MAGeCKFlute66 and ggplot2 R package.
Cell growth competition assay
Cells were transduced with Cas9, selected with blasticidin for 1 week, and then transduced with the sgRNA constructs containing RFP overexpression (at least 2 per gene; Table S6). At 3 days (t0) and then after 14 population doublings (t1), cells were analyzed by flow cytometry. Flow cytometry data were acquired on 16 laser BDFortessa. All data were analyzed using the FlowJo (V10) software. The percentage of RFP positive cells was determined by gating using uninfected Cas9 cells for each cell line.
Protein extraction and western blot analysis
Whole cell lysates were prepared in SDS Lysis Buffer (ThermoFisher) and resolved on 3–8% or 4–12% gradient SDS-PAGE gels (ThermoFisher) transferred to nitrocellulose membrane, blocked in 5% non-fat milk in PBS plus 0.5% Tween 20, probed with primary antibodies and detected with horseradish peroxidase-conjugated α-rabbit or α-mouse secondary antibodies (Cell Signaling). The blots were imaged using a ChemiDoc MP Imaging system (Bio-Rad) or exposed to X-ray films (Research Products International).
Viability assays and treatments
For 72h viability assays, 1500 kP cells, 3000 A549 or 5000 H2009 cells were plated in 96-well plates in RPMI-1640 medium, the next day cells were treated, and cell viability was determined 72h post treatment using CCK8 assay (Dojindo). AUC and IC50s were determined using the Graphpad Prism v6 and v9 software. For 5-day assays, 1500 kP or KPK cells were plated in 12-well plates in RPMI-1640 medium, the next day cells were treated, and cell viability was determined post treatment by Crystal Violet stain (Sigma). For induction of NRF2 activation in KP carrying dox-inducible NRF2ΔNeh2, cells were treated with 1μM KI-696 (Papagiannakopoulos lab) or 1 μg/ml Doxycycline (Sigma-Aldrich) for 7 days before experiments. For siRNA treatments, cells were transfected using the RNAiMax reagent (Thermo Fisher #13778) according to the manufacturer’s instructions with the indicated siRNA, and viability was determined by Cell titer Glo 2.0 (Promega).
The concentration of in vitro Romidepsin treatments throughout the study was adjusted to account for differences in cell number and plate well size, as well as due to use of two stocks with different potency (second batch of drug was 5 to 10-fold more potent).
Allograft and xenograft studies
For KP and A549 in vivo studies, C57BL/6 mice or Foxn1nu mice were subcutaneously injected with KP (5 × 10⁵ per injection) and A549 (Figures 7F and S7B 5 × 10⁶ per injection; Figures 7I and 7J 2 × 10⁶ per injection) cells respectively into the flanks (2 injections/mouse). Mice were treated after tumor establishment, approximately 5 days post injection. Subsequent intraperitoneal (IP) treatments and tumor measurements were performed 2–3 times a week on the days indicated in each figure. Romidepsin (1 mg/kg IP; Medchem Express) was dissolved in 10% DMSO in Corn oil (Sigma Aldrich). CB-839 (200 mg/kg Orally; twice a day; CALITHERA) was formulated in 25% (w/v) hydroxypropyl-β-cyclodextrin in 10 mmol/L citrate (pH 2.0), at 20 mg/mL for a final dosing volume of 10 mL/kg.
For the Patient-derived xenograft (PDX) experiment, KEAP1-mutant (MSK-LX-337) and KEAP1-WT (MSK-LX-210) PDX were established in a previous study.10 PDX tumors were stored in cryo-tubes in 10% dimethyl sulphoxide (DMSO) containing Dulbecco’s Modified Eagle Medium (DMEM) media containing 10% FBS and 20 μg/ml Gentamicin. After stabilized and expanding in NOD-scid IL2R gamma null (NSG) mice, tumors were trimmed with the size of 3 mm × 3 mm x 3 mm and subcutaneously transplanted near both flanks into NSG male and female littermates approximately 6–8 weeks in age. Engraftment was checked every 5 days after transplantation. After the tumor establishment phase, animals were randomized and assigned to a treatment group. Tumor volume was measured by caliper and volume was calculated (Length x Width2 x 0.5). Animals either received Romidepsin 1 mg/kg or vehicle Corn Oil twice weekly administered through intraperitoneal injection. The treatment volume was settled as 100 μL per mouse. Tumor growth was tracked for a minimum of 8 tumors per experimental group. Tumors with volume less than 20 mm3 at the time of the first measurement were excluded from the final analysis.
Statistical analyses were done using Prism (v9), specifically two-way ANOVA was used for comparison of tumor growth between each condition and Fisher’s Least Significant Difference for multiple comparisons. For comparisons of tumor volumes and weights, the test was chosen by performing D’Agostino-Pearson and Shapiro-Wilk normality test: if both conditions passed both tests, Student’s t-test was used, otherwise we performed Mann-Whitney U-test.
CUT&Tag
CUT&Tag was performed as described previously,27 with an additional step of light fixation to better preserve histone acetylation/TF binding. In brief, 1 × 10⁵ cells were lightly fixed with 0.1% paraformaldehyde 5′, neutralized by Glycine 125mM, and washed once with 1 mL of wash buffer (20 mM HEPES pH 7.5, 150 mM NaCl, 0.5 mM Spermidine (Sigma-Aldrich), 1 × Protease inhibitor cocktail (Roche)). Concanavalin A-coated magnetic beads (Bangs Laboratories) were washed twice with binding buffer (20 mM HEPES pH 7.5, 10 mM KCl, 1 mM MnCl2, 1 mM CaCl2). 10 μL/sample of beads were added to cells in 400ul of wash buffer and incubated at room temperature for 15 min. Beads-bound cells were resuspended in 100 μL of antibody buffer (20 mM HEPES pH 7.5, 150 mM NaCl, 0.5 mM Spermidine, 0.06% Digitonin (Sigma-Aldrich), 2 mM EDTA, 0.1% BSA, 1× Protease inhibitor cocktail and incubated with indicated antibodies or normal rabbit IgG (Cell Signaling) at 4° overnight on nutator. After being washed once with Dig-wash buffer (20 mM HEPES pH 7.5, 150 mM NaCl, 0.5 mM Spermidine, 0.05% Digitonin, 1× Protease inhibitor cocktail), beads-bound cells were incubated with 1 μL Guinea pig anti-rabbit secondary antibody (Antibodies Online ABIN101961) and 2 μL Hyperactive pA-Tn5 Transposase adapter complex in 100 μL Dig-300 buffer (20 mM HEPES-NaOH, pH 7.5, 0.5 mM Spermidine, 1× Protease inhibitor cocktail, 300 mM NaCl, 0.01% Digitonin) at room temperature for 1 h. Cells were washed three times with Dig-300 buffer to remove unbound antibody and Tn5 and then resuspended in 300 μL of tagmentation buffer (10 mM MgCl2 in Dig-300 buffer) and incubated at 37°C for 1 h. 10 μL of 0.5 M EDTA, 3 μL of 10% SDS and 5 μL of 10 mg/mL Proteinase K were added to each sample and incubated at 50°C for 1 h to terminate tagmentation. DNA was purified using chloroform isoamyl alcohol (Sigma Aldrich) and eluted with 25 μL ddH2O. For library amplification, 21 μL of DNA was mixed with 2μL i5 unique index primer (10 μM), 2 μL i7 unique index primer (10 μM) and 25 μL NEBNext High-Fidelity 2X PCR Master Mix (NEB) and subjected to the following PCR program: 72°C, 5 min; 98°C, 30 s; 13 cycles of 98°C, 10 sand 63°C, 10 s; 72°C, 1 min and hold at 10°C. To purify the PCR products, 1.1× volumes of pre-warmed Ampure XP beads (Beckman Coulter) were added and incubated at room temperature for 10 min. Libraries were washed twice with 80% ethanol and eluted in 20 μL of 10 mM Tris-HCl, pH 8. Libraries were sequenced on an NextSeq 550 platform (Illumina, 75 cycles High Output Kit v2.0) and 75-bp paired-end reads were generated. To determine global level differences in histone acetylation signal we used spike-in controls. For H3K27ac, 2ul of SNAP-ChIP K-AcylStat panel nucleosomes (EpiCypher) was added as spike-in control at the primary antibody incubation step. For H4ac, 5000 S2 Drosophila cells were added at the cell-bead binding step. For BRD4, 10000 K562 cells were added at the cell-bead binding step.
CUT&Tag data analysis
CUT&Tag reads of KP cell samples were mapped to the mouse genome assembly mm10 using Bowtie264 (v2.3.5.1, parameters: –local –very-sensitive-local –no-unal –no-mixed –no-discordant –phred33 -I 10 -X 700). Potential PCR duplicates were removed by the function “MarkDuplicates” (parameter: REMOVE_DUPLICATES = true) of Picard (v2.24.2). Genomic enrichments of CUT&Tag signals were generated using deeptools (v3.3.2, parameters bamCoverage –normalizeUsing CPM –binSize 25 –smoothLength 100) and visualized using IGV.67 Peaks were called using MACS268 (parameters: –f BAMPE -g mm –broad). Consensuses of H3K27ac, H4ac and BRD4 peaks across conditions were generated by the ‘cat’ function (Linux) and ‘sort’ and ‘merge’ functions of bedtools (v2.27.1). The read counts of H3K27ac, H4ac and BRD4 CUT&Tag data in genomic elements were measured by featureCounts (v2.0.0).69 Differential analysis was performed using DEseq2(v1.32.0).70 Peak annotation was done using ChIPseeker71(v1.28.3). Heatmaps were generated using deeptools (v3.3.2) functions computeMatrix and plotHeatmap. For visualization we used the R package ggplot273 (v3.3.2). For genome-wide signal correlations we used deeptools (v3.3.2) functions multiBigwigSummary and plotCorrelation. Promoters were defined as 2.5kb regions centered around the TSS. Random regions were generated by the using the shuffle function of bedtools (v2.27.1) and the peak consensus as input.
For all analyses, duplicates were considered for each condition, except EV ROM BRD4 where we excluded one replicate due to poor quality. For peak annotation we use the consensus of two replicates (Figure 3B). For normalized signal heatmaps one representative replicate is shown for each condition (Figures 3C and S3G). For figures indicating CPM we calculate the average of two replicates (Figures 3D and 3E, 3G, S3F, and 4G). For differential read count analysis we performed DEseq2 analysis with two replicates (Figure 3F).
To assess global level differences in CUT&Tag signal we compared the ratio of spike-in reads to total number of reads and determined the scaling factor. For K27ac, the number of reads for each barcode was counted and used the ratio of H3K27ac to total H3 as the scaling factor. For H4ac, reads were mapped to the Drosophila genome (Dmel_A4_1.0) and the mapping percentage was used to determine the scaling factor. For BRD4, reads were mapped to the human genome (GRCh38) and the mapping percentage was used to determine the scaling factor.
RNA isolation, quantitative reverse transcription PCR (RT-qPCR) and RNA-sequencing
Total RNA was extracted in TRIzol (Invitrogen) and precipitated in ethanol (DECON Labs). For qRT-PCR, cDNA was then synthesized with cDNA Synthesis Kit (Takara) according to the manufacturer’s protocols. The relative expression of targeted genes was measured by qRT-PCR with indicated primers (Table S6) and SYBR Green Master Mix (ThermoFisher) using the ABI 7500 Real-Time PCR Detection System (Applied Biosystems). For RNA-sequencing, RNA samples were submitted to Columbia University Genome Center for library preparation, sequencing and bioinformatic analysis up to generation of a reads count table of each gene. For control and CB839-resistant cell lines RNA-sequencing libraries were prepared using NEBNext Ultra kit (New England Biolabs #E7490, #E7770, #E7335, #E7500) and sequenced using a Nextseq500/550 sequencer. Paired-end reads were obtained and to the mouse genome assembly mm10 using Bowtie2 (v2.3.5.1). The mapped reads count of each gene was measured by feature-Counts (v1.6.1). The differential gene expression was calculated by the R package DESeq2 (v1.28.0), and visualization was done using ggplot2 (v3.3.2) R package.
DepMap dataset analysis
The datasets that were used were the CERES 21Q3 Public+Score and the Prism repurposing secondary screen 19Q4. Data were downloaded for subsets that included NSCLC cell lines with or without KEAP1 mutations. For statistical analysis, the test was chosen by performing D’Agostino-Pearson and Shapiro-Wilk normality test: if both conditions passed both tests, Student’s t-test was used, otherwise we performed Mann-Whitney U-test. For CERES, comparison of the mutant and wild-type cell line subsets was done by calculating the gene-effect difference between the two.
Metabolic tracing
For glucose tracing analysis, 2x10⁵ kP cells (n = 3) were plated in 6-well plates overnight in RPMI medium (Sigma). After 24 h, the media was replaced with fresh RPMI medium containing DMSO or Romidepsin. At 48 h the media was replaced with fresh glucose-free RPMI medium (Sigma) containing 10% dialyzed fetal bovine serum (Gibco), 2.0 g/L 13C6-glucose (Sigma) and DMSO or 5nM Romidepsin. Cells were harvested at 49 and 72 h and processed as described below.
For glutamine tracing, 2x10⁵ kP cells (n = 3) were plated in 6-well plates overnight in RPMI medium (Sigma). After 24 h, the media was replaced with fresh RPMI medium containing DMSO, 1nM Romidepsin or 150nM CB-839. At 48 h the media was replaced with fresh glutamine-free RPMI medium (Sigma) containing 10% dialyzed fetal bovine serum (Gibco), 2.0 g/L 13C5-glutamine (Cambridge Isotope Laboratories) and DMSO, 1nM Romidepsin or 150nM CB-839. Cells were harvested at 56 h and processed as described below.
Metabolite harvesting and liquid chromatography-mass spectrometry analysis
Cells were washed with cold PBS, lysed in 80% Ultra LC-MS acetonitrile (Thermo Scientific) supplemented with 20 μM deuterated 2-hydroxyglutarate (D-2-hydroxyglutaric-2,3,3,4,4-d5 acid (d5-2HG), Cambridge Isotope Laboratories) as an internal standard on ice for 15 min, and centrifuged for 10 min at 20,000 x g at 4°C. 200 μL of supernatants were subjected to mass spectrometry analysis. Liquid chromatography was performed using an Agilent 1290 Infinity LC system (Agilent, Santa Clara, US) coupled to a Q-TOF 6545 mass spectrometer (Agilent, Santa Clara, US). A hydrophilic interaction chromatography method with a ZIC-pHILIC column (150 × 2.1 mm, 5 μm; EMD Millipore) was used for compound separation at 35°C with a flow rate of 0.3 mL/min. Mobile phase A consisted of 25 mM ammonium carbonate in water and mobile phase B was acetonitrile. The gradient elution was 0–1.5 min, 80% B; 1.5–7 min, 80% B → 50% B, 7–8.5 min, 50% B; 8.5–8.7 min, 50% B → 80% B, 8.7–13 min, 80% B. The overall runtime was 13 min, and the injection volume was 5 μL. The Agilent Q-TOF was operated in negative mode and the relevant parameters were as listed: ion spray voltage, 3500 V; nozzle voltage, 1000 V; fragmentor voltage, 125 V; drying gas flow, 11 L/min; capillary temperature, 325°C; drying gas temperature, 350°C; and nebulizer pressure, 40 psi. A full scan range was set at 50 to 1600 (m/z). The reference masses were 119.0363 and 980.0164. The acquisition rate was 2 spectra/s. Targeted analysis, isotopologues extraction (for the metabolic tracing study), and natural isotope abundance correction were performed by the Agilent Profinder B.10.00 Software (Agilent Technologies).
These data are available at the NIH Common Fund’s National Metabolomics Data Repository (NMDR) Website, the Metabolomics Workbench,77 https://www.metabolomicsworkbench.org where they have been assigned Project ID ST002999. The data can be accessed directly via the Project DOI: https://doi.org/10.21228/M84F0M.
Histology
Tumors were fixed in 10% Formalin (Fisher Chemical) for 48 h and then stored in 70% ethanol at 4°C. Paraffin embedding and sectioning was done at the Histology Service of the Molecular Pathology Shared Resource at Columbia University Medical center. Immunohistochemistry experiments were done at Experimental Pathology Research Laboratory at New York University Langone Health. We evaluated at least 4 tumors per condition by measuring signal intensity on whole sections (1 section per tumor). Quantitation of signal was done using QuPath software74 (v0.3.2) and statistical analysis using Prism (v9) and Fisher’s Least Significant Difference for multiple comparisons.
Glutamine and glucose consumption
2x10⁵ KP cells (n = 3) were plated in 6-well plates overnight in RPMI medium (Sigma). After 24 h, the media was replaced with fresh RPMI medium containing DMSO, 1nM Romidepsin or 150nM CB-839. At 48 h the media was replaced with fresh glutamine-free RPMI medium (Sigma) containing DMSO, 1nM Romidepsin or 150nM CB-839. Media were harvested at 56 h, centrifuged to remove dead cells and frozen at −80°C. Cells were harvested and counted. Measurement of metabolites was done using a YSI 7000 enzymatic analyzer at the Cell Metabolism core that is part of the Donald B. and Catherine C. Marron Cancer Metabolism Center at the Memorial Sloan Kettering Cancer Center. Consumption was calculated by comparison to media from wells without any cells.
QUANTIFICATION AND STATISTICAL ANALYSIS
All data were processed and analyzed using Excel, Graphpad prism (Versions 6 and 8) or R. For comparisons, we performed normality test (D’Agostino’s K-squared test) and used unpaired or paired two-tailed Student’s t-test, Mann-Whitney U test or one-way-ANOVA as described in the corresponding figure legend. All experiments were repeated at least twice with three replicates involved. The results in Figures were presented as group mean and standard error of the mean (SEM), unless indicated otherwise in the figure legend. Statistical significance is indicated with asterisks as follows: ns, no significance; *p <0.05; **, p <0.01; ***, p <0.001; ****, p < 0.0001.
Supplementary Material
KEY RESOURCES TABLE
| REAGENT or RESOURCE | SOURCE | IDENTIFIER |
|---|---|---|
| Antibodies | ||
| acetyl-H4 | Invitrogen | PA1-84526 RRID:AB_2116718 |
| H3K27ac | Active motif | 39034 RRID:AB_2722569 |
| normal IgG-Rabbit | Cell Signaling | 2729 RRID:AB_1031062 |
| HDAC1 | Cell Signaling | 5356 RRID:AB_10612242 |
| HDAC2 | Cell Signaling | mAb#5113 RRID:AB_10624871 |
| HDAC3 | Cell Signaling | mAb#3949 RRID:AB_2118371 |
| BRD4 | epicypher | SKU: 13-2003 |
| NRF2 | Papagiannakopoulos lab | N/A |
| MYC (WB) | Cell Signaling | 9402 RRID:AB_2151827 |
| MYC (IHC) | Abcam | ab32072 RRID:AB_731658 |
| GMPS | Bethyl | A302-417A RRID:AB_1907300 |
| IMPDH2 | Proteintech | 12948-1-AP RRID:AB_2127351 |
| TYMS | Bethyl | A304-000A RRID:AB_2620349 |
| ATF4 | Cell Signaling | 11815 RRID:AB_2616025 |
| Biological samples | ||
| Paraffin embedded sections of KP tumors | This study | N/A |
| Paraffin embedded sections of PDX tumors | This study | N/A |
| Chemicals, peptides, and recombinant proteins | ||
| Romidepsin | MedChemExpress | HY-15149 |
| Entinostat | MedChemExpress | HY-12163 |
| ACY-957 | MedChemExpress | HY-104008 |
| Vorinostat(SAHA) | Selleckchem | S1047 |
| Belinostat | Selleckchem | S1085 |
| KI-696 | Papagiannakopoulos lab | N/A |
| Doxycycline Hydrochloride | Sigma Aldritch | D3072 |
| CB-839 | CALITHERA | N/A |
| U-13C Glucose | Sigma Aldritch | 389374 |
| U-13C Glutamine | Cambridge Isotope Laboratories | CLM-1822-H-PK |
| Quisinostat | MedChemExpress | HY-15433 |
| Fimepinostat | MedChemExpress | HY-13522 |
| Panobinostat | MedChemExpress | HY-10224 |
| Tucidinostat | MedChemExpress | HY-109015 |
| RGFP966 | Selleckchem | S7229 |
| siHdac3 | Horizon - Dharmacon | LQ-043553-02-0005 |
| siHDAC3 | Horizon - Dharmacon | L-003496-00-0005 |
| siCTRL | Horizon - Dharmacon | D-001810-10-05 |
| Penicillin-Streptomycin | Sigma-Aldrich | P4458 |
| Puromycin | Sigma-Aldrich | P9620 |
| Hygromycin B | Sigma-Aldrich | 10843555001 |
| Blasticidin | Sigma-Aldrich | SBR00022 |
| Critical commercial assays | ||
| Cell Counting Kit-8 | Dojindo | CK04-20 |
| PureLink™ Genomic DNA Mini Kit | Thermo Fisher | K182001 |
| RNAiMax | Thermo Fisher | #13778 |
| Cell titer Glo 2.0 | Promega | G9241 |
| cDNA Synthesis Kit | Takara | RR037B |
| NEBNext Ultra kit | New England Biolabs | #E7490, #E7770, #E7335, #E7500 |
| Deposited data | ||
| CUT&Tag | Gene Expression Omnibus | GEO: GSE220832 |
| RNA-sequencing | Gene Expression Omnibus | GEO: GSE220837 |
| CRISPR/Cas9 screen | Gene Expression Omnibus | GEO: GSE220831 |
| Metabolomics | Metabolomics workbench | Metabolomics Workbench: ST002999 |
| Experimental models: Cell lines | ||
| KP1: KrasG12D/+; p53−/−;sgTomato mouse LUAD | Papagiannakopoulos lab10 | N/A |
| KP2: KrasG12D/+; p53−/−;sgTomato mouse LUAD | Papagiannakopoulos lab10 | N/A |
| KPK1: KrasG12D/+; p53−/−;sgKeap1 mouse LUAD | Papagiannakopoulos lab10 | N/A |
| KPK2: KrasG12D/+; p53−/−;sgKeap1 mouse LUAD | Papagiannakopoulos lab10 | N/A |
| KP1 Cas9 | This study | N/A |
| KP2 Cas9 | This study | N/A |
| KPK1 Cas9 | This study | N/A |
| KPK2 Cas9 | This study | N/A |
| KP1 empty pCDH vector (referred to as EV) | This study | N/A |
| KP1 NRF2dNeh2 (referred to as NRF2) | This study | N/A |
| KP1 dox-inducible NRF2dNeh2 | This study | N/A |
| KPK1 Luciferase (control to KPK1 KEAP1) | This study | N/A |
| KPK1 KEAP1 | This study | N/A |
| KP1 EV empty LVX vector | This study | N/A |
| KP1 EV SLC1A5 | This study | N/A |
| KP1 NRF2 empty LVX vector | This study | N/A |
| KP1 NRF2 SLC1A5 | This study | N/A |
| A549 | ATCC | CCL-185 |
| A549 Cas9 sgCTRL | This study | N/A |
| A549 Cas9 sgNRF2 | This study | N/A |
| H2009 | ATCC | CRL-5911 |
| H2009 KEAP1 | This study | N/A |
| H2009 KEAP1R470C | This study | N/A |
| Experimental models: Organisms/strains | ||
| C57BL/6 mice | Jackson Laboratory | RRID:IMSR_JAX:000664 |
| Foxn1nu mice | Jackson Laboratory | RRID:IMSR_JAX:007850 |
| NOD-scid IL2R gamma null (NSG) mice | Jackson Laboratory | RRID:IMSR_JAX:005557 |
| Oligonucleotides | ||
| See Table S6 | This paper | N/A |
| Recombinant DNA | ||
| psPAX2 | gift from Didier Trono | RRID:Addgene_12260 |
| pVSVG | Steward et al.62 | RRID:Addgene_8454 |
| pCDH-EF1-NRF2ΔNeh2-MCS-IRES-Puro | This study | N/A |
| lentiCas9-Blast | Sanjana et al.63 | RRID:Addgene_52962 |
| pCLXSN(GFP)-HA-Slc1a5 (mouse) | gift from Shao-Cong Sun | RRID:Addgene_71458 |
| pLVX-IRES-mCherry | Takara bio | 631237 |
| pUSEPR (U6-sgRNA-EFS-Puro-P2A-TurboRFP in pLL3-based lentiviral backbone) | Yadira Soto-Feliciano | N/A |
| TRE-NRF2ΔNeh2-EFS_rtTA_P2A_Puro in LV2 | This study | N/A |
| LV2_RPBSA_Hygro_EF1a_hKEAP1 | Papagiannakopoulos lab | N/A |
| LV2_RPBSA_Hygro_EF1a_hKEAP1R470C | Papagiannakopoulos lab | N/A |
| Software and algorithms | ||
| Graphpad Prism v6 and v9 | Graphpad Software | N/A |
| Bowtie2 | Langmead et al.64 | N/A |
| Picard (v2.24.2). | https://github.com/broadinstitute/picard/releases/tag/3.1.1 | N/A |
| MAGeCK | Li et al.65 | N/A |
| MAGeCKFlute | Wang et al.66 | N/A |
| IGV | Robinson et al.67 | N/A |
| MACS2 | Zhang et al.68 | N/A |
| bedtools (v2.27.1). | https://github.com/arq5x/bedtools2 | N/A |
| FlowJo v10 | FlowJo software | N/A |
| featureCounts (v2.0.0). | Liao et al.69 | N/A |
| DEseq2(v1.32.0). | Love et a.70 | N/A |
| ChIPseeker71(v1.28.3). | Wang et al.71 | N/A |
| deeptools (v3.3.2) | Ramirez et al.72 | N/A |
| ggplot2 (v3.3.2) | Wickham73 | N/A |
| FIJI - ImageJ | https://imagej.net/software/fiji/ | N/A |
| Agilent Profinder B.10.00 Software | Agilent Technologies | N/A |
| QuPath software (v0.3.2) | Bankhead et al.74 | N/A |
Highlights.
NRF2-active cells are sensitive to class I histone deacetylase inhibition
HDAC inhibition causes genomic redistribution of histone acetylation and BRD4
Epigenomic reprogramming leads to downregulation of metabolic genes
HDAC inhibition suppresses metabolic pathways critical for NRF2-active cell growth
ACKNOWLEDGMENTS
We thank members of the Lu lab for critical reading of the manuscript. We thank Tahir Sheikh and the Gary Swartz lab for sharing reagents. We thank Zhiming Li and the Zhiguo Zhang lab for assistance with library sequencing. We thank Jozef Piotr Bossowski for assistance with ATF4 expertise and immunohistochemistry (IHC) staining. We thank the Donald B. and Catherine C. Marron Cancer Metabolism Center at the Memorial Sloan Kettering Cancer Center (MSKCC) for the help with metabolite consumption analysis. This study was funded by NIH (R35GM138181 and R01DE031873 to C.L.). D.K. acknowledges support from an NYSTEM training grant. Research reported in this publication was performed in the CCTI Flow Cytometry Core, supported in part by the Office of the Director, NIH, under award S10OD020056. The content is solely the responsibility of the authors and does not necessarily represent the official views of the NIH. IHC experiments performed by the NYU Experimental Pathology Research Laboratory were funded in part by the NYUCI Center Support Grant “NIH/NCI 5 P30CA16087.” F.J.S.-R. was supported by the MSKCC TROT program (5T32CA160001) and a GMTEC Postdoctoral Researcher Innovation Grant and is an HHMI Hanna Gray Fellow. Y.M.S.-F. was supported by the Damon Runyon-Sohn Pediatric Cancer Fellowship (DRSG-21-17) and the NIGMS-Mosaic K99/R00 Career Development Award (1K99GM140265). J.Y. was supported by an American Cancer Society Research Scholar Grant (RSG-20-036-01). Public availability of metabolomics is supported by the Metabolomics Workbench/National Metabolomics Data Repository (NMDR) (grant no. U2C-DK119886), the Common Fund Data Ecosystem (CFDE) (grant no. 3OT2OD030544), the Metabolomics Consortium Coordinating Center (M3C) (grant no. 1U2C-DK119889), and NIH grant U2C-DK119886.
Footnotes
SUPPLEMENTAL INFORMATION
Supplemental information can be found online at https://doi.org/10.1016/j.celrep.2023.113629.
DECLARATION OF INTERESTS
The authors declare no competing interests.
REFERENCES
- 1.Lu C, and Thompson CB (2012). Metabolic regulation of epigenetics. Cell Metab. 16, 9–17. [DOI] [PMC free article] [PubMed] [Google Scholar]
- 2.Carrer A, Trefely S, Zhao S, Campbell SL, Norgard RJ, Schultz KC, Sidoli S, Parris JLD, Affronti HC, Sivanand S, et al. (2019). Acetyl-CoA Metabolism Supports Multistep Pancreatic Tumorigenesis. Cancer Discov. 9, 416–435. [DOI] [PMC free article] [PubMed] [Google Scholar]
- 3.Figueroa ME, Abdel-Wahab O, Lu C, Ward PS, Patel J, Shih A, Li Y, Bhagwat N, Vasanthakumar A, Fernandez HF, et al. (2010). Leukemic IDH1 and IDH2 mutations result in a hypermethylation phenotype, disrupt TET2 function, and impair hematopoietic differentiation. Cancer Cell 18, 553–567. [DOI] [PMC free article] [PubMed] [Google Scholar]
- 4.Lu C, Ward PS, Kapoor GS, Rohle D, Turcan S, Abdel-Wahab O, Edwards CR, Khanin R, Figueroa ME, Melnick A, et al. (2012). IDH mutation impairs histone demethylation and results in a block to cell differentiation. Nature 483, 474–478. [DOI] [PMC free article] [PubMed] [Google Scholar]
- 5.Menegon S, Columbano A, and Giordano S (2016). The Dual Roles of NRF2 in Cancer. Trends Mol. Med 22, 578–593. [DOI] [PubMed] [Google Scholar]
- 6.Mitsuishi Y, Taguchi K, Kawatani Y, Shibata T, Nukiwa T, Aburatani H, Yamamoto M, and Motohashi H (2012). Nrf2 Redirects Glucose and Glutamine into Anabolic Pathways in Metabolic Reprogramming. Cancer Cell 22, 66–79. [DOI] [PubMed] [Google Scholar]
- 7.Itoh K, Chiba T, Takahashi S, Ishii T, Igarashi K, Katoh Y, Oyake T, Hayashi N, Satoh K, Hatayama I, et al. (1997). An Nrf2/small Maf heterodimer mediates the induction of phase II detoxifying enzyme genes through antioxidant response elements. Biochem. Biophys. Res. Commun 236, 313–322. [DOI] [PubMed] [Google Scholar]
- 8.Hammerman PS, Hayes DN, and Grandis JR (2015). Therapeutic insights from genomic studies of head and neck squamous cell carcinomas. Cancer Discov. 5, 239–244. [DOI] [PMC free article] [PubMed] [Google Scholar]
- 9.Ichimura Y,Waguri S, Sou YS, Kageyama S, Hasegawa J, Ishimura R, Saito T, Yang Y, Kouno T, Fukutomi T, et al. (2013). Phosphorylation of p62 Activates the Keap1-Nrf2 Pathway during Selective Autophagy. Mol. Cell 51, 618–631. [DOI] [PubMed] [Google Scholar]
- 10.Romero R, Sayin VI, Davidson SM, Bauer MR, Singh SX, LeBoeuf SE, Karakousi TR, Ellis DC, Bhutkar A, Sánchez-Rivera FJ, et al. (2017). Keap1 loss promotes Kras-driven lung cancer and results in dependence on glutaminolysis. Nat. Med 23, 1362–1368. [DOI] [PMC free article] [PubMed] [Google Scholar]
- 11.Sayin VI, LeBoeuf SE, Singh SX, Davidson SM, Biancur D, Guzelhan BS, Alvarez SW, Wu WL, Karakousi TR, Zavitsanou AM, et al. (2017). Activation of the NRF2 antioxidant program generates an imbalance in central carbon metabolism in cancer. Elife 6, e28083. [DOI] [PMC free article] [PubMed] [Google Scholar]
- 12.Song S, Nguyen V, Schrank T, Mulvaney K, Walter V, Wei D, Orvis T, Desai N, Zhang J, Hayes DN, et al. (2020). Loss of SWI/SNF Chromatin Remodeling Alters NRF2 Signaling in Non-Small Cell Lung Carcinoma. Mol. Cancer Res 18, 1777–1788. [DOI] [PMC free article] [PubMed] [Google Scholar]
- 13.Karlsson A, Jönsson M, Lauss M, Brunnström H, Jönsson P, Borg Å, Jönsson G, Ringnér M, Planck M, and Staaf J (2014). Genomewide DNA Methylation Analysis of Lung Carcinoma Reveals One Neuroendocrine and Four Adenocarcinoma Epitypes Associated with Patient Outcome. Clin. Cancer Res 20, 6127–6140. [DOI] [PubMed] [Google Scholar]
- 14.Sánchez-Rivera FJ, Papagiannakopoulos T, Romero R, Tammela T, Bauer MR, Bhutkar A, Joshi NS, Subbaraj L, Bronson RT, Xue W, and Jacks T (2014). Rapid modelling of cooperating genetic events in cancer through somatic genome editing. Nature 516, 428–431. [DOI] [PMC free article] [PubMed] [Google Scholar]
- 15.Soto-Feliciano YM, Sanchez-Rivera FJ, Perner F, Barrows DW, Kastenhuber ER, Ho Y-J, Carroll TS, Xiong Y, Anand D, Soshnev AA, et al. (2023). A molecular switch between mammalian MLL complexes dictates response to Menin-MLL inhibition. Cancer Discov. 13, 146–169. [DOI] [PMC free article] [PubMed] [Google Scholar]
- 16.Pacini C, Dempster JM, Boyle I, Gonçalves E, Najgebauer H, Karakoc E, van der Meer D, Barthorpe A, Lightfoot H, Jaaks P, et al. (2021). Integrated cross-study datasets of genetic dependencies in cancer. Nat. Commun 12, 1661. [DOI] [PMC free article] [PubMed] [Google Scholar]
- 17.Meyers RM, Bryan JG, McFarland JM, Weir BA, Sizemore AE, Xu H, Dharia NV, Montgomery PG, Cowley GS, Pantel S, et al. (2017). Computational correction of copy number effect improves specificity of CRISPR-Cas9 essentiality screens in cancer cells. Nat. Genet 49,1779–1784. [DOI] [PMC free article] [PubMed] [Google Scholar]
- 18.Zhang Y, Remillard D, Onubogu U, Karakyriakou B, Asiaban JN, Ramos AR, Bowland K, Bishop TR, Barta PA, Nance S, et al. (2023). Collateral lethality between HDAC1 and HDAC2 exploits cancer-specific NuRD complex vulnerabilities. Nat. Struct. Mol. Biol 30, 1160–1171. [DOI] [PMC free article] [PubMed] [Google Scholar]
- 19.Seto E, and Yoshida M (2014). Erasers of Histone Acetylation: The Histone Deacetylase Enzymes. Cold Spring Harb. Perspect. Biol 6, a018713. [DOI] [PMC free article] [PubMed] [Google Scholar]
- 20.Wilting RH, Yanover E, Heideman MR, Jacobs H, Horner J, van der Torre J, DePinho RA, and Dannenberg J-H (2010). Overlapping functions of Hdac1 and Hdac2 in cell cycle regulation and haematopoiesis. EMBO J. 29, 2586–2597. [DOI] [PMC free article] [PubMed] [Google Scholar]
- 21.Itoh K, Wakabayashi N, Katoh Y, Ishii T, Igarashi K, Engel JD, and Yamamoto M (1999). Keap1 represses nuclear activation of antioxidant responsive elements by Nrf2 through binding to the amino-terminal Neh2 domain. Genes Dev. 13, 76–86. [DOI] [PMC free article] [PubMed] [Google Scholar]
- 22.Lechner S, Malgapo MIP, Grätz C, Steimbach RR, Baron A, Rüther P, Nadal S, Stumpf C, Loos C, Ku X, et al. (2022). Target deconvolution of HDAC pharmacopoeia reveals MBLAC2 as common off-target. Nat. Chem. Biol 18, 812–820. [DOI] [PMC free article] [PubMed] [Google Scholar]
- 23.Furumai R, Matsuyama A, Kobashi N, Lee K-H, Nishiyama M, Nakajima H, Tanaka A, Komatsu Y, Nishino N, Yoshida M, and Horinouchi S (2002). FK228 (Depsipeptide) as a Natural Prodrug That Inhibits Class I Histone Deacetylases. Cancer Res. 62, 4916–4921. [PubMed] [Google Scholar]
- 24.Gaymes TJ, Padua RA, Pla M, Orr S, Omidvar N, Chomienne C, Mufti GJ, and Rassool FV (2006). Histone Deacetylase Inhibitors (HDI) Cause DNA Damage in Leukemia Cells: A Mechanism for Leukemia-Specific HDI-Dependent Apoptosis? Mol. Cancer Res 4, 563–573. [DOI] [PubMed] [Google Scholar]
- 25.Stankov MV, El Khatib M, Kumar Thakur B, Heitmann K, Panayotova-Dimitrova D, Schoening J, Bourquin JP, Schweitzer N, Leverkus M, Welte K, et al. (2014). Histone deacetylase inhibitors induce apoptosis in myeloid leukemia by suppressing autophagy. Leukemia 28, 577–588. [DOI] [PMC free article] [PubMed] [Google Scholar]
- 26.Karagiannis D, and Rampias T (2021). HDAC Inhibitors: Dissecting Mechanisms of Action to Counter Tumor Heterogeneity. Cancers 13, 3575. [DOI] [PMC free article] [PubMed] [Google Scholar]
- 27.Kaya-Okur HS, Wu SJ, Codomo CA, Pledger ES, Bryson TD, Henikoff JG, Ahmad K, and Henikoff S (2019). CUT&Tag for efficient epigenomic profiling of small samples and single cells. Nat. Commun 10, 1930. [DOI] [PMC free article] [PubMed] [Google Scholar]
- 28.Slaughter MJ, Shanle EK, Khan A, Chua KF, Hong T, Boxer LD, Allis CD, Josefowicz SZ, Garcia BA, Rothbart SB, et al. (2021). HDAC inhibition results in widespread alteration of the histone acetylation landscape and BRD4 targeting to gene bodies. Cell Rep. 34, 108638. [DOI] [PMC free article] [PubMed] [Google Scholar]
- 29.Galan-Cobo A, Sitthideatphaiboon P, Qu X, Poteete A, Pisegna MA, Tong P, Chen P-H, Boroughs LK, Rodriguez MLM, Zhang W, et al. (2019). LKB1 and KEAP1/NRF2 Pathways Cooperatively Promote Metabolic Reprogramming with Enhanced Glutamine Dependence in KRAS-Mutant Lung Adenocarcinoma. Cancer Res. 79, 3251–3267. [DOI] [PMC free article] [PubMed] [Google Scholar]
- 30.DeNicola GM, Chen P-H, Mullarky E, Sudderth JA, Hu Z, Wu D, Tang H, Xie Y, Asara JM, Huffman KE, et al. (2015). NRF2 regulates serine biosynthesis in non-small cell lung cancer. Nat. Genet 47, 1475–1481. [DOI] [PMC free article] [PubMed] [Google Scholar]
- 31.LeBoeuf SE, Wu WL, Karakousi TR, Karadal B, Jackson SR, Davidson SM, Wong K-K, Koralov SB, Sayin VI, and Papagiannakopoulos T (2020). Activation of Oxidative Stress Response in Cancer Generates a Druggable Dependency on Exogenous Non-essential Amino Acids. Cell Metab. 31, 339–350.e4. [DOI] [PMC free article] [PubMed] [Google Scholar]
- 32.Bhutia YD, and Ganapathy V (2016). Glutamine transporters in mammalian cells and their functions in physiology and cancer. Biochim. Biophys. Acta 1863, 2531–2539. [DOI] [PMC free article] [PubMed] [Google Scholar]
- 33.Buescher JM, Antoniewicz MR, Boros LG, Burgess SC, Brunenraber H, Clish CB, DeBerardinis RJ, Feron O, Frezza C, Ghesuiere B, et al. (2015). A roadmap for interpreting 13C metabolite labeling patterns from cells. Curr. Opin. Biotechnol 34, 189–201. [DOI] [PMC free article] [PubMed] [Google Scholar]
- 34.Nguyen TTT, Zhang Y, Shang E, Shu C, Torrini C, Zhao J, Bianchetti E, Mela A, Humala N, Mahajan A, et al. (2020). HDAC inhibitors elicit metabolic reprogramming by targeting super-enhancers in glioblastoma models. J. Clin. Invest 130, 3699–3716. [DOI] [PMC free article] [PubMed] [Google Scholar]
- 35.Wardell SE, Ilkayeva OR, Wieman HL, Frigo DE, Rathmell JC, Newgard CB, and McDonnell DP (2009). Glucose Metabolism as a Target of Histone Deacetylase Inhibitors. Mol. Endocrinol 23, 388–401. [DOI] [PMC free article] [PubMed] [Google Scholar]
- 36.Jin J, Byun J-K, Choi Y-K, and Park K-G (2023). Targeting glutamine metabolism as a therapeutic strategy for cancer. Exp. Mol. Med 55, 706–715. [DOI] [PMC free article] [PubMed] [Google Scholar]
- 37.Hast BE, Cloer EW, Goldfarb D, Li H, Siesser PF, Yan F, Walter V, Zheng N, Hayes DN, and Major MB (2014). Cancer-Derived Mutations in KEAP1 Impair NRF2 Degradation but not Ubiquitination. Cancer Res. 74, 808–817. [DOI] [PMC free article] [PubMed] [Google Scholar]
- 38.Davies TG, Wixted WE, Coyle JE, Griffiths-Jones C, Hearn K, McMenamin R, Norton D, Rich SJ, Richardson C, Saxty G, et al. (2016). Monoacidic Inhibitors of the Kelch-like ECH-Associated Protein 1: Nuclear Factor Erythroid 2-Related Factor 2 (KEAP1:NRF2) Protein–Protein Interaction with High Cell Potency Identified by Fragment-Based Discovery. J. Med. Chem 59, 3991–4006. [DOI] [PubMed] [Google Scholar]
- 39.Hammad A, Namani A, Elshaer M, Wang XJ, and Tang X (2019). “NRF2 addiction” in lung cancer cells and its impact on cancer therapy. Cancer Lett. 467, 40–49. [DOI] [PubMed] [Google Scholar]
- 40.Zavitsanou A-M, Pillai R, Hao Y, Wu WL, Bartnicki E, Karakousi T, Rajalingam S, Herrera A, Karatza A, Rashidfarrokhi A, et al. (2023). KEAP1 mutation in lung adenocarcinoma promotes immune evasion and immunotherapy resistance. Cell Reports 42, 113295. 10.1016/j.celrep.2023.113295. [DOI] [PMC free article] [PubMed] [Google Scholar]
- 41.Singh A, Daemen A, Nickles D, Jeon S-M, Foreman O, Sudini K, Gnad F, Lajoie S, Gour N, Mitzner W, et al. (2021). NRF2 Activation Promotes Aggressive Lung Cancer and Associates with Poor Clinical Outcomes. Clin. Cancer Res 27, 877–888. [DOI] [PMC free article] [PubMed] [Google Scholar]
- 42.Ding H, Chen Z, Wu K, Huang SM, Wu WL, LeBoeuf SE, Pillai RG, Rabinowitz JD, and Papagiannakopoulos T (2021). Activation of the NRF2 antioxidant program sensitizes tumors to G6PD inhibition. Sci. Adv 7, eabk1023. [DOI] [PMC free article] [PubMed] [Google Scholar]
- 43.Fu J, Xiong Z, Huang C, Li J, Yang W, Han Y, Paiboonrungruan C, Major MB, Chen K-N, Kang X, and Chen X (2019). Hyperactivity of the transcription factor Nrf2 causes metabolic reprogramming in mouse esophagus. J. Biol. Chem 294, 327–340. [DOI] [PMC free article] [PubMed] [Google Scholar]
- 44.Alam H,Tang M, Maitituoheti M, Dhar SS, Kumar M, Han CY, Ambati CR, Amin SB, Gu B, Chen T-Y, et al. (2020). KMT2D Deficiency Impairs Super-Enhancers to Confer a Glycolytic Vulnerability in Lung Cancer. Cancer Cell 37, 599–617.e7. [DOI] [PMC free article] [PubMed] [Google Scholar]
- 45.Chung C, Sweha SR, Pratt D, Tamrazi B, Panwalkar P, Banda A, Bayliss J, Hawes D, Yang F, Lee H-J, et al. (2020). Integrated Metabolic and Epigenomic Reprograming by H3K27M Mutations in Diffuse Intrinsic Pontine Gliomas. Cancer Cell 38, 334–349.e9. [DOI] [PMC free article] [PubMed] [Google Scholar]
- 46.Panwalkar P, Tamrazi B, Dang D, Chung C, Sweha S, Natarajan SK, Pun M, Bayliss J, Ogrodzinski MP, Pratt D, et al. (2021). Targeting integrated epigenetic and metabolic pathways in lethal childhood PFA ependymomas. Sci. Transl. Med 13, eabc0497. [DOI] [PMC free article] [PubMed] [Google Scholar]
- 47.Di Marcantonio D, Martinez E, Kanefsky JS, Huhn JM, Gabbasov R, Gupta A, Krais JJ, Peri S, Tan Y, Skorski T, et al. (2021). ATF3 coordinates serine and nucleotide metabolism to drive cell cycle progression in acute myeloid leukemia. Mol. Cell 81, 2752–2764.e6. [DOI] [PMC free article] [PubMed] [Google Scholar]
- 48.Bates SE (2020). Epigenetic Therapies for Cancer. N. Engl. J. Med 383, 650–663. [DOI] [PubMed] [Google Scholar]
- 49.Iyer SP, and Foss FF (2015). Romidepsin for the Treatment of Peripheral T-Cell Lymphoma. Oncol. 20, 1084–1091. [DOI] [PMC free article] [PubMed] [Google Scholar]
- 50.Mann BS, Johnson JR, Cohen MH, Justice R, and Pazdur R (2007). FDA Approval Summary: Vorinostat for Treatment of Advanced Primary Cutaneous T-Cell Lymphoma. Oncol. 12, 1247–1252. [DOI] [PubMed] [Google Scholar]
- 51.Diesch J, Zwick A, Garz A-K, Palau A, Buschbeck M, and Götze KS (2016). A clinical-molecular update on azanucleoside-based therapy for the treatment of hematologic cancers. Clin. Epigenetics 8, 71. [DOI] [PMC free article] [PubMed] [Google Scholar]
- 52.Pfister SX, and Ashworth A (2017). Marked for death: targeting epigenetic changes in cancer. Nat. Rev. Drug Discov 16, 241–263. [DOI] [PubMed] [Google Scholar]
- 53.Ganesan A, Arimondo PB, Rots MG, Jeronimo C, and Berdasco M (2019). The timeline of epigenetic drug discovery: from reality to dreams. Clin. Epigenetics 11, 174. [DOI] [PMC free article] [PubMed] [Google Scholar]
- 54.Alcarraz-Vizán G, Boren J, Lee W-NP, and Cascante M (2010). Histone deacetylase inhibition results in a common metabolic profile associated with HT29 differentiation. Metabolomics. 6, 229–237. [DOI] [PMC free article] [PubMed] [Google Scholar]
- 55.Srivatsan SR, McFaline-Figueroa JL, Ramani V, Saunders L, Cao J, Packer J, Pliner HA, Jackson DL, Daza RM, Christiansen L, et al. (2020). Massively multiplex chemical transcriptomics at single-cell resolution. Science 367, 45–51. [DOI] [PMC free article] [PubMed] [Google Scholar]
- 56.Yang J, Jin X, Yan Y, Shao Y, Pan Y, Roberts LR, Zhang J, Huang H, and Jiang J (2017). Inhibiting histone deacetylases suppresses glucose metabolism and hepatocellular carcinoma growth by restoring FBP1 expression. Sci. Rep 7, 43864. [DOI] [PMC free article] [PubMed] [Google Scholar]
- 57.Bernfeld E, and Foster DA (2019). Glutamine as an Essential Amino Acid for KRas-Driven Cancer Cells. Trends Endocrinol. Metab 30, 357–368. [DOI] [PubMed] [Google Scholar]
- 58.Son J, Lyssiotis CA, Ying H, Wang X, Hua S, Ligorio M, Perera RM, Ferrone CR, Mullarky E,Shyh-Chang N, et al. (2013). Glutamine supports pancreatic cancer growth through a Kras-regulated metabolic pathway. Nature 496, 101–105. [DOI] [PMC free article] [PubMed] [Google Scholar]
- 59.Basseville A,Violet P-C, Safari M, Sourbier C, Linehan WM, Robey RW, Levine M, Sackett DL, and Bates SE (2022). A Histone Deacetylase Inhibitor Induces Acetyl-CoA Depletion Leading to Lethal Metabolic Stress in RAS-Pathway Activated Cells. Cancers (Basel) 14, 2643. [DOI] [PMC free article] [PubMed] [Google Scholar]
- 60.Scalise M, Pochini L, Console L, Losso MA, and Indiveri C (2018). The Human SLC1A5 (ASCT2) Amino Acid Transporter: From Function to Structure and Role in Cell Biology. Front. Cell Dev. Biol 6, 96. [DOI] [PMC free article] [PubMed] [Google Scholar]
- 61.Utsunomiya-Tate N, Endou H, and Kanai Y (1996). Cloning and Functional Characterization of a System ASC-like Na+-dependent Neutral Amino Acid Transporter. J. Biol. Chem 271, 14883–14890. [DOI] [PubMed] [Google Scholar]
- 62.Stewart SA, Dykxhoorn DM, Palliser D, Mizuno H, Yu EY, An DS, Sabatini DM, Chen ISY, Hahn WC, Sharp PA, et al. (2003). Lentivirus-delivered stable gene silencing by RNAi in primary cells. RNA 9, 493–501. [DOI] [PMC free article] [PubMed] [Google Scholar]
- 63.Sanjana NE, Shalem O, and Zhang F (2014). Improved vectors and genome-wide libraries forCRISPR screening. Nat. Methods 11, 783–784. [DOI] [PMC free article] [PubMed] [Google Scholar]
- 64.Langmead B, and Salzberg SL (2012). Fast gapped-read alignment with Bowtie 2. Nat. Methods 9, 357–359. [DOI] [PMC free article] [PubMed] [Google Scholar]
- 65.Li W, Xu H, Xiao T, Cong L, Love MI, Zhang F, Irizarry RA, Liu JS, Brown M, and Liu XS (2014). MAGeCK enables robust identification of essential genes from genome-scale CRISPR/Cas9 knockout screens. Genome Biol. 15, 554. [DOI] [PMC free article] [PubMed] [Google Scholar]
- 66.Wang B, Wang M, Zhang W, Xiao T, Chen C-H, Wu A, Wu F, Traugh N, Wang X, Li Z, et al. (2019). Integrative analysis of pooled CRISPR genetic screens using MAGeCKFlute. Nat. Protoc 14, 756–780. [DOI] [PMC free article] [PubMed] [Google Scholar]
- 67.Robinson JT, Thorvaldsdóttir H, Winckler W, Guttman M, Lander ES, Getz G, and Mesirov JP (2011). Integrative genomics viewer. Nat. Biotechnol 29, 24–26. [DOI] [PMC free article] [PubMed] [Google Scholar]
- 68.Zhang Y, Liu T, Meyer CA, Eeckhoute J, Johnson DS, Bernstein BE, Nusbaum C, Myers RM, Brown M, Li W, and Liu XS (2008). Model-based Analysis of ChIP-Seq (MACS). Genome Biol. 9, R137. [DOI] [PMC free article] [PubMed] [Google Scholar]
- 69.Liao Y, Smyth GK, and Shi W (2014). featureCounts: an efficient general purpose program for assigning sequence reads to genomic features. Bioinformatics 30, 923–930. [DOI] [PubMed] [Google Scholar]
- 70.Love MI, Huber W, and Anders S (2014). Moderated estimation of fold change and dispersion for RNA-seq data with DESeq2. Genome Biol. 15, 550. [DOI] [PMC free article] [PubMed] [Google Scholar]
- 71.Wang Q, Li M, Wu T, Zhan L, Li L, Chen M, Xie W, Xie Z, Hu E, Xu S, and Yu G (2022). Exploring Epigenomic Datasets by ChIPseeker. Curr. Protoc 2, e585. [DOI] [PubMed] [Google Scholar]
- 72.Ramírez F, Ryan DP, Grüning B, Bhardwaj V, Kilpert F, Richter AS, Heyne S, Dündar F, and Manke T (2016). deepTools2: a next generation web server for deep-sequencing data analysis. Nucleic Acids Research 44, W160–W165. 10.1093/nar/gkw257. [DOI] [PMC free article] [PubMed] [Google Scholar]
- 73.Wickham H. (2016). ggplot2 (Springer International Publishing; ). [Google Scholar]
- 74.Bankhead P, Loughrey MB, Fernández JA, Dombrowski Y, McArt DG, Dunne PD, McQuaid S, Gray RT, Murray LJ, Coleman HG,et al. (2017). QuPath: Open source software for digital pathology image analysis. Sci. Rep 7, 16878. [DOI] [PMC free article] [PubMed] [Google Scholar]
- 75.Doench JG, Fusi N, Sullender M, Hegde M, Vaimberg EW, Donovan KF, Smith I, Tothova Z, Wilen C, Orchard R, et al. (2016). Optimized sgRNA design to maximize activity and minimize off-target effects of CRISPR-Cas9. Nat. Biotechnol 34, 184–191. [DOI] [PMC free article] [PubMed] [Google Scholar]
- 76.Strezoska Ž, Licon A, Haimes J, Spayd KJ, Patel KM, Sullivan K, Jastrzebski K, Simpson KJ, Leake D, van Brabant Smith A, and Vermeulen A (2012). Optimized PCR Conditions and Increased shRNA Fold Representation Improve Reproducibility of Pooled shRNA Screens. PLOS ONE 7, e42341. [DOI] [PMC free article] [PubMed] [Google Scholar]
- 77.Sud M, Fahy E, Cotter D, Azam K, Vadivelu I, Burant C, Edison A, Fiehn O, Higashi R, Nair KS, et al. (2016). Metabolomics Workbench: An international repository for metabolomics data and metadata, metabolite standards, protocols, tutorials and training, and analysis tools. Nucleic Acids Res. 44, D463–D470. [DOI] [PMC free article] [PubMed] [Google Scholar]
Associated Data
This section collects any data citations, data availability statements, or supplementary materials included in this article.
Supplementary Materials
Data Availability Statement
All high throughput sequencing data included in this study are available in GEO accession number GSE220839. Metabolomics data are available in The Metabolomics Workbench Project: https://doi.org/10.21228/M84F0M. All other original data reported in this paper are available from the lead contact upon request.
This paper does not report original code.
Any additional information required to reanalyze the data reported in this work paper is available from the lead contact upon request.