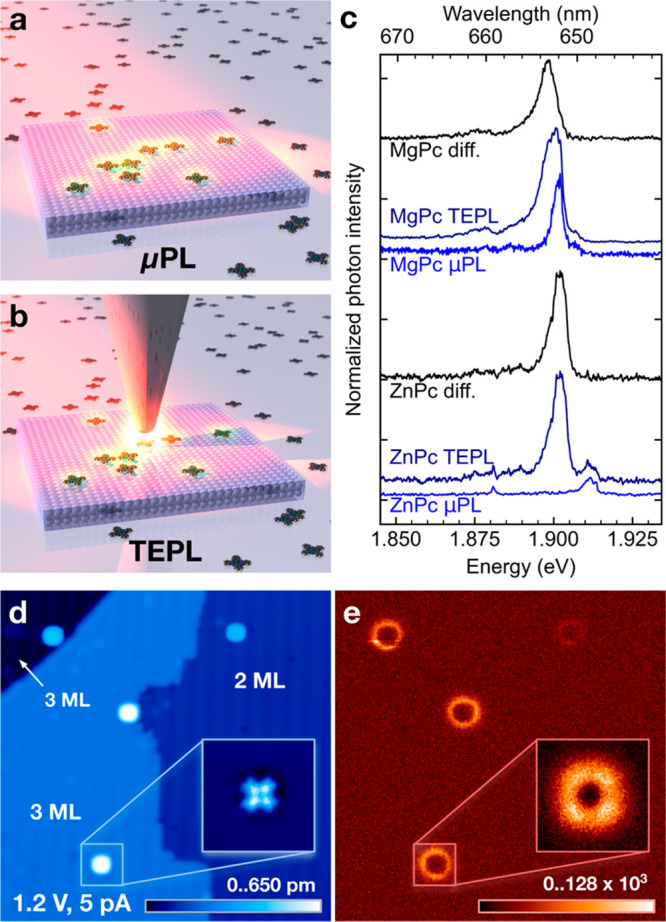
Figure 1.

Schemes of (a) the far-field μPL experiment with molecules on a decoupling layer and (b) the near-field + far-field TEPL experiment of a single molecule. (c) Comparison of the μPL, TEPL, and difference spectra for the Mg- and ZnPc adsorbed on 2–3 ML NaCl/Ag(111). The MgPc TEPL spectrum was measured at 1.2 V and 1.7 pA set point, and the μPL spectrum was obtained with the tip retracted 1 nm from the set point. The ZnPc TEPL was measured at 1.2 V and 5 pA set point, and the μPL spectrum was obtained with the tip retracted 120 nm from the set point. (d) STM topography of MgPc/2–3 ML NaCl/Ag(111), size 44 × 44 nm2, tunneling conditions 1.2 V, 5 pA, 3 ms per pixel. (e) APD map of the identical area, taken simultaneously and rebinned from 512 × 512 to 256 × 256 pixels for better contrast. The insets in (d, e) are taken simultaneously in the constant-height mode in the transport gap at −0.7 V, maximum current 1 pA, and total laser power 100 μW, resulting in peak rate 130 × 103 events/point, image size 4 × 4 nm2, and the original APD map rebinned from 128 × 128 to 64 × 64 pixels.
