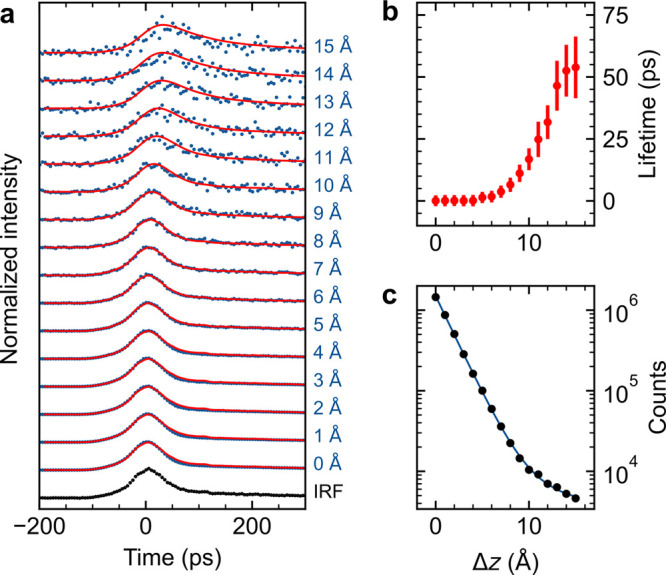
Figure 4.

(a) Details of the Δz dependence of the TCSPC measured on the S1–S0 emission of a single MgPc from Figure 2b after subtraction of the μPL background (measured away from the molecule) and intensity normalization. The IRF (black) is used for the iterative reconvolution of the fluorescence data with a monoexponential decay. (b) Exciton lifetime obtained from the monoexponential fit as a function of relative tip–molecule distance. (c) Sum TEPL intensity obtained from the signal in (a) as a function of Δz (black dots) fitted with a biexponential function (blue curve).
