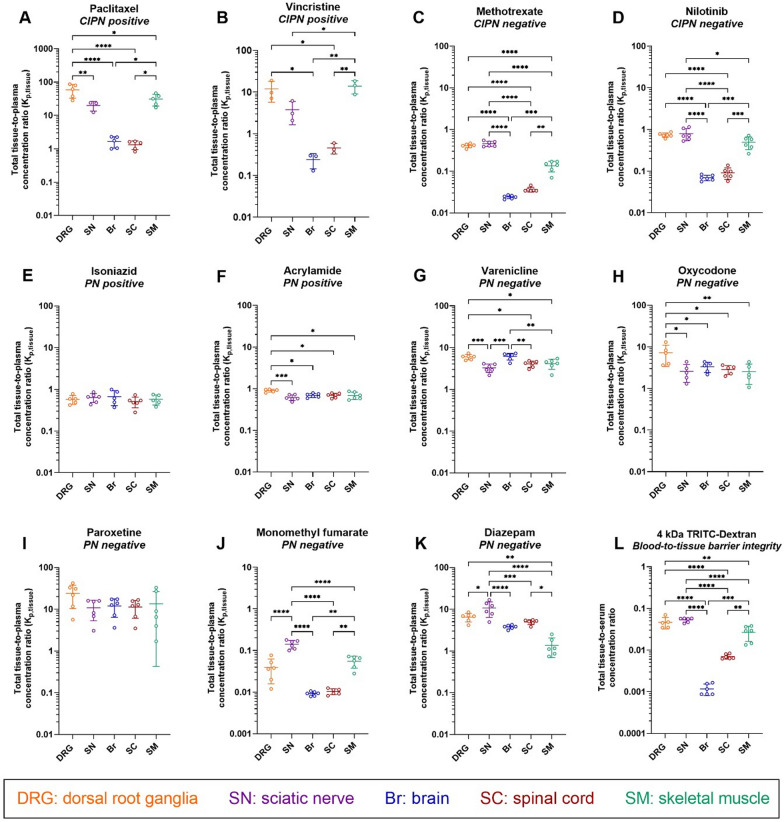
Fig. 2.
Scatter dot plots of the total tissue-to-plasma concentration ratio (Kp,tissue) determined at steady-state for the indicated drugs and the total tissue-to-serum concentration ratio of 4 kDa TRITC-dextran in the indicated tissues. A–K Measurements for the different drugs, with their CIPN and PN propensity indicated. L Measurements for 4 kDa TRITC-dextran. Data are shown as the mean ± SD, n = 3–6 biological replicates. *p < 0.05, **p < 0.01, ***p < 0.001, or ****p < 0.0001 (ordinary one-way ANOVA with Tukey’s multiple comparison test). NB: note the differences in scale

