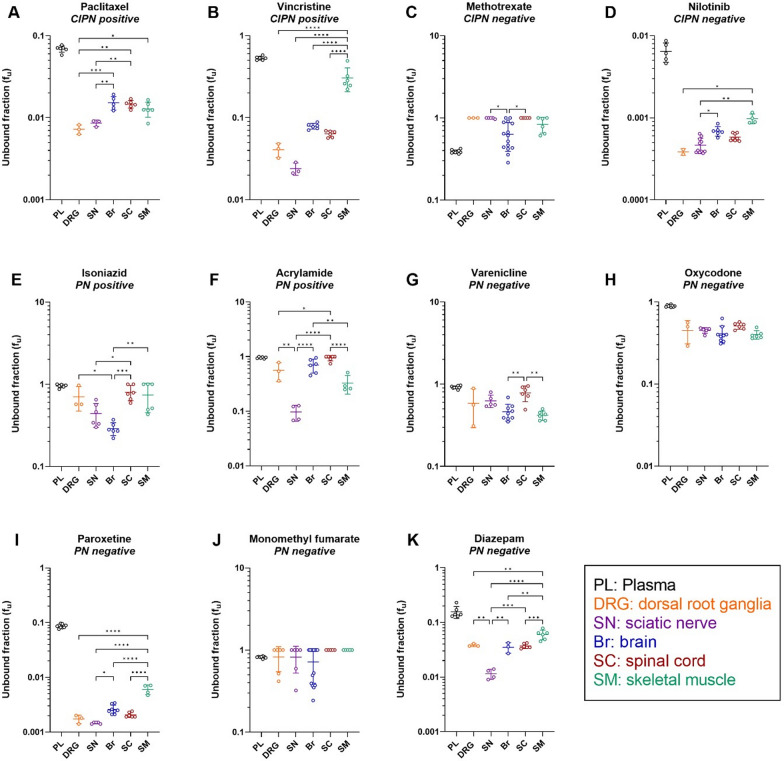
Fig. 4.
Scatter dot plots of unbound fraction (fu) of the indicated drugs in the plasma in the specified tissues. This parameter describes the extent of drug binding to plasma proteins, as well as DRG, SN, Br, SC, and SM tissue constituents. A–K Measurements for the different drugs, with their CIPN and PN status indicated. Data are presented as the mean ± SD. See Additional file 2: Table S4 for the details of the number of biological and technical replicates of each experiment. *p < 0.05, **p < 0.01, ***p < 0.001, or ****p < 0.0001 (ordinary one-way ANOVA with Tukey’s multiple comparison test or Kailas–Kruskal test followed by Dunn’s multiple comparison test). NB: note the differences in scale

