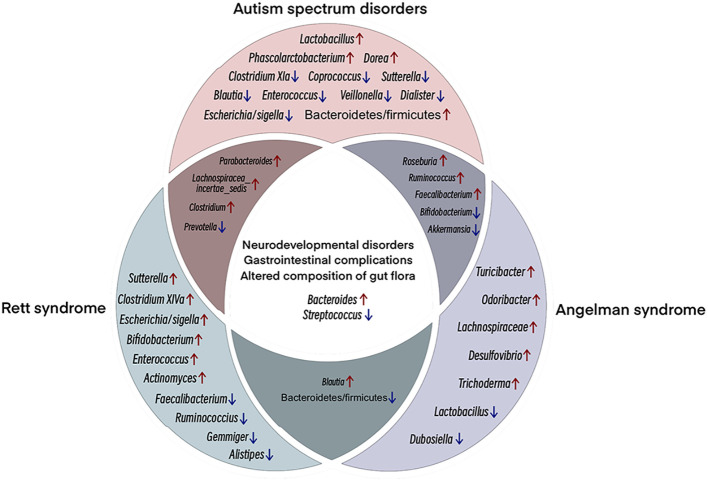
Figure 3.
Venn diagram showing shared clinical and microbial features among ASD, RTT, and AS. NDDs with similar clinical features show some microbial compositional features that are enriched/reduced in the same taxa. The main overlap, both clinical and microbial. Among the three NDDs, ASD, RTT and AS, multiple studies have shown increased abundance of Bacteroides and decreased abundance of Streptococcus. Different colored circles represent different NDDs; pink, ASD; green, RTT; purple, AS. Overlapping regions have the same abundance trend. Red arrows, increasing relative abundance, blue arrows, decreasing relative abundance.

