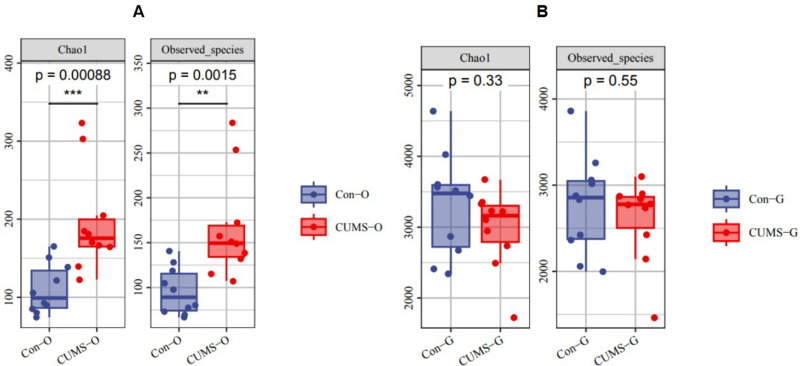
Figure 2.
Difference of alpha diversity in the two groups. (A) Differences in alpha diversity of oral flora in the two groups. (B) Differences in alpha diversity of gut flora in the two groups. (O stands for oral flora, G stands for gut flora; Chao1 and Observed species represent the bacterial richness; the larger the value is, the higher the bacterial richness), (n=10), (**P<0.01,***P<0.001).

