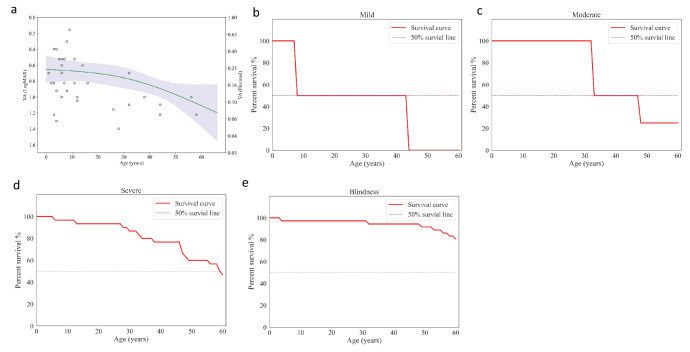
Figure 5.
Age impact on VA. (a) The spline regression model of VA and age. (b–e) Kaplan–Meier survival analysis of different visual function indicators for age: survival curves for best-corrected visual acuity (BCVA) of 0.30 logMAR (b); survival curves for BCVA of 0.48 logMAR (c); survival curves for BCVA of 1.00 logMAR (d); and survival curves for BCVA of 1.30 logMAR (e).

