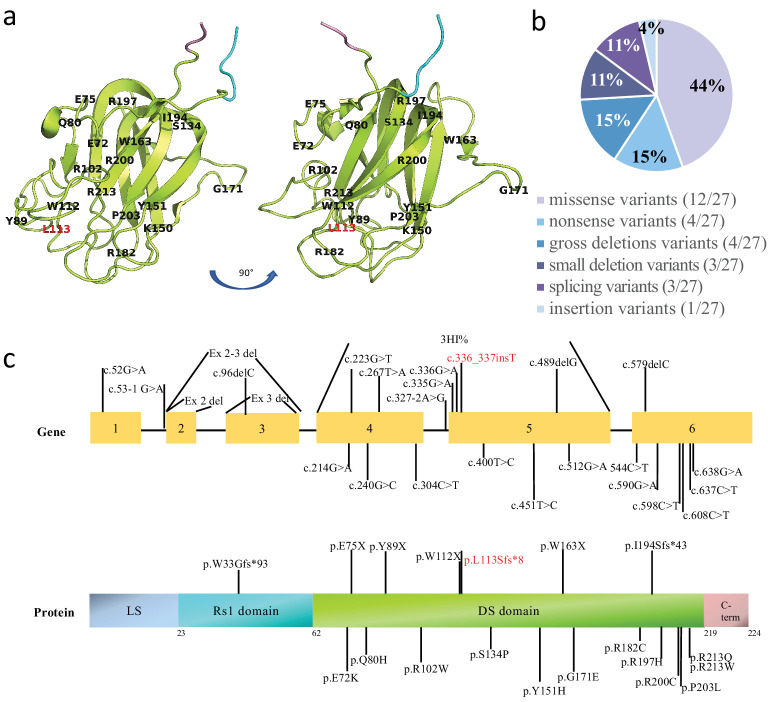
Figure 6.
Distribution of reported variants within RS1. (a) The genomic location of the variants in the homology model of RS1 (PDB-3JD6). The RS1 domain is shown in cyan, the DS domain in lemon, and the C-terminal in pink. (b) The spectrum of the 27 RS1 variants. (c) The distribution of the variants; the frequency of variants in each exon is indicated in the bar plot. The locations of variants in the gene and the protein are marked by lines.

