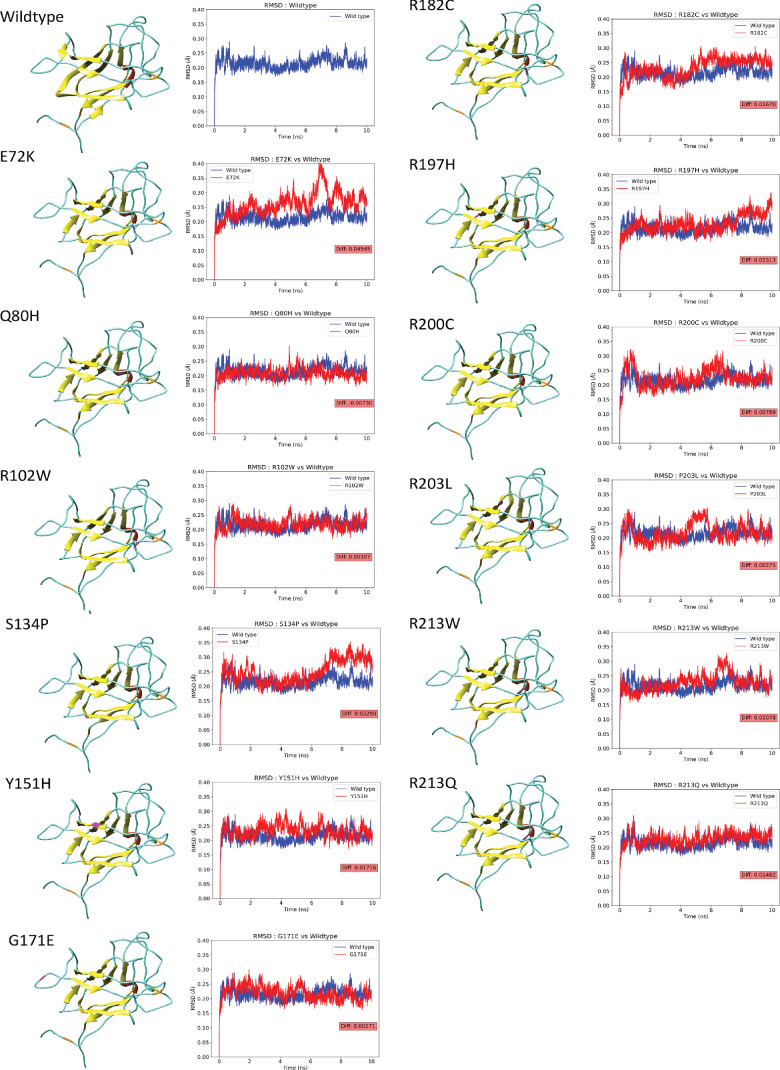
Figure 7.
Structure and RMSD graph of wild-type and variant forms of RS1 in MD simulation. In the 3D structure, helices are shown in red, strand in yellow, coli in cyan, disulfide bonds in orange, and variant spots in magenta. The RMSD graph shows the deviation of the backbone in the wild-type (blue) and variant (red) forms of RS1 during the MD simulation. Their difference is represented in the red box.

