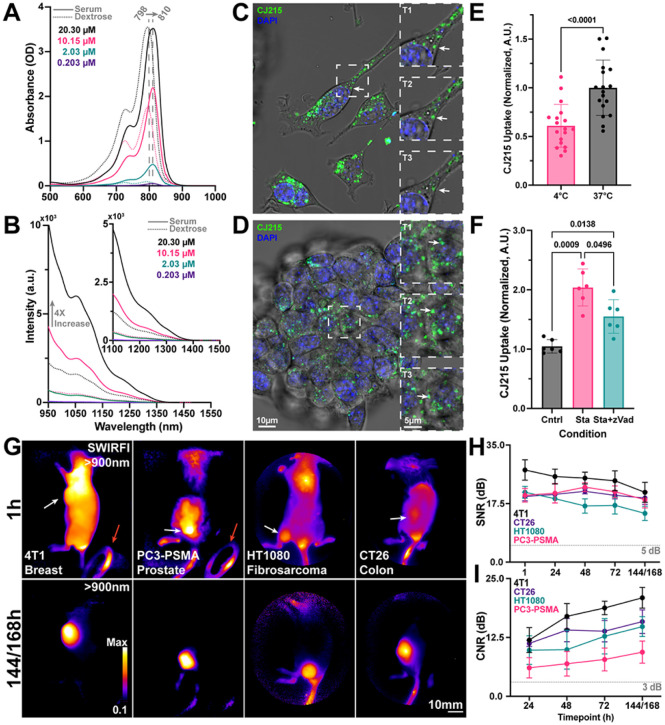
Figure 1. CJ215 spectral, in vitro, and in vivo assessment.
A) The absorption of CJ215 dissolved in either fetal bovine serum (solid line) or dextrose (dotted line) was assessed at concentrations from 20.30 μM to 0.203 μM. The entire absorption spectrum red shifted in serum 12nm from a peak of 798 to 810 nm, like that of ICG. B) The SWIR emission tail of the dye was characterized from 950 to 1550 nm with notable emission past 1100 nm and a 4x increase in intensity when dissolved in serum vs dextrose. C) Representative single cell NIR confocal microscopy localization uptake of CJ215 (green, 3hr incubation period) in 4T1 cells, stained with DAPI (nucleus) with polarized white light images overlayed (grayscale). Inset, zoom in of vesicles containing CJ215 and their transport within the cell highlighting vesicle localization (T1=0s, T2=+23.175s, T3=+38.625s). D) Representative Z-stack slice of CJ215 uptake in 4T1 spheroids (green, 3hr incubation period), inset, zoomed in image highlighting vesicle transport over time (T1=0s, T2=+17.962s, T3=+35.924s). Supplemental videos 1 and 2 further show vesicle transport. E) CJ215 uptake in 4T1 cells is based upon active transport with cells incubated with the dye at 37°C showing significantly increased (39.067%, Welch’s two sided, unpaired, parametric t-test) uptake compared to those incubated with CJ215 at 4°C, mean and standard deviation (SD) are shown based on n=18 technical replicates from n=3 biological replicates (6 well plates). F) Cell damage and apoptosis induction by staurosporine (Sta) significantly increases CJ215 uptake in HT1080 cells by 99.298% compared to control cells. zVad-FMK (zVAD, an apoptosis blocker) combined with Sta reduced maximum uptake (48.826%) compared to Sta alone. Mean, SD, and replicates (dots) are shown with statistical analysis shown based on a non-paired or matched Welch and Brown-Forsythe ANOVA with Dunnet T3 multiple comparisons test. G) Ambient light resistant SWIRFI based (>900 nm) screening of four tumor cell lines including 4T1 (breast, orthotopic, murine), PC3-PSMA (prostate, heterotopic, human), HT1080 (fibrosarcoma, orthotopic, human) and CT26 (colon, heterotopic, murine). Top, representative images of all tumor lines 1 hr post intravenous systemic injection of CJ215. Fluorescence reflections are visible in the ambient lighting LED (red arrow, circular object in bottom right). Bottom, images of tumor uptake and localization of CJ215 144 or 168 hrs post injection at video rate exposures (1–10ms). In all cases the tumor can be readily delineated. H) Signal to noise ratio (SNR, dB) quantification of all tumor lines. At all timepoints sufficient SNR is achieved above the 5dB threshold with exposure times ranging from 1–2 ms (808nm excitation, ~300 mW/cm2). I) Contrast to noise ratio (CNR, dB) quantification for all tumors and all mice, where sufficient contrast is achieved (above 3dB threshold) 24hrs post injection with CNR steadily increasing up to 144/168 hrs for all tested tumor lines. In all cases the mean (dot) and SD are shown from n=4 mice per tumor line (n=16 mice total).

