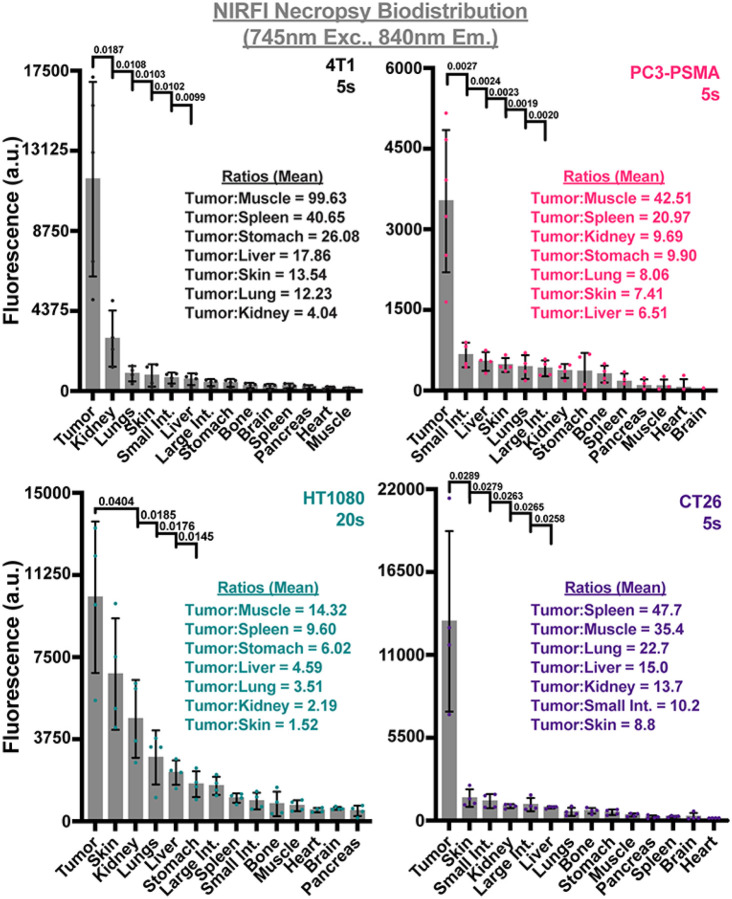
Figure 4. NIRFI (745nm excitation, 840nm emission) necropsy biodistribution assessment of CJ215 in four tumor models.
Following resection various organs were harvested for necropsy based biodistribution assessment via NIRFI (IVIS Spectrum, 745nm excitation, 840nm emission) at exposure times from 5–20s. Tumors had the highest level of uptake in all tumor models. Residual kidney fluorescence identifies renal clearance of CJ215. Organs are shown in order of decreasing fluorescence intensity with notable tumor/organ ratios shown. Select p values from unpaired parametric Welch’s t test comparing tumor to organs are shown with the mean (gray bar), SD (black bars) and individual replicates shown (dots, n=4 mice).

