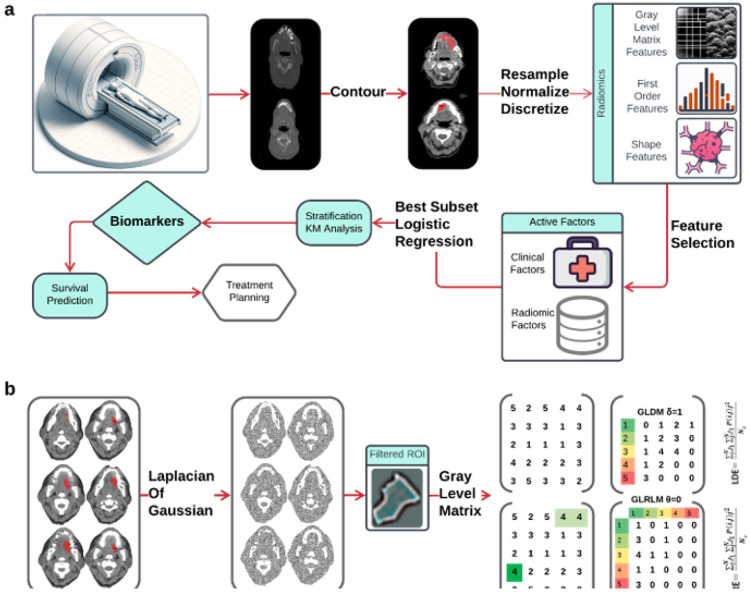
Figure 1.
a Schematic flowchart illustrating the steps from CT image acquisition and radiomics feature extraction, through the process of machine learning techniques to risk factors. b Axial contrast-enhanced CT image of the oral cavity with a red region of interest (ROI) indicating the squamous cell carcinoma. The images were filtered by Laplacian of Gaussian (LoG) and analyzed to extract LDE and LRE features.

