
Figure 3.
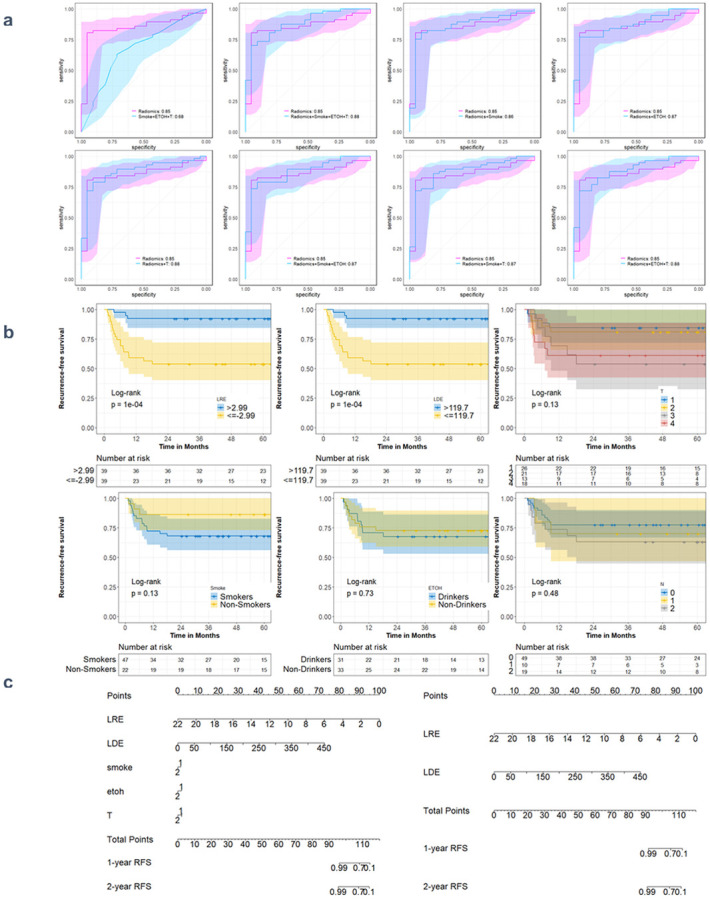
a These plots illustrate the logistic ROC, delineating comparisons between the full model, which incorporates previously identified radiomic and clinical features, and alternative combinations. The numbers next to each model in the legend give the AUC. b The Kaplan-Meier survival curves demonstrate a significant contrast (p = 1e-04) in recurrence-free survival (RFS) between high/low-end radiomic risk groups. c Side-by-side comparison of nomograms illustrating RFS probability predictions for the cohort. On the left, the "Full Model" includes both radiomic and clinical factors, while on the right, the "radiomics-Only Model" consists of two identified radiomic risk factors exclusively.