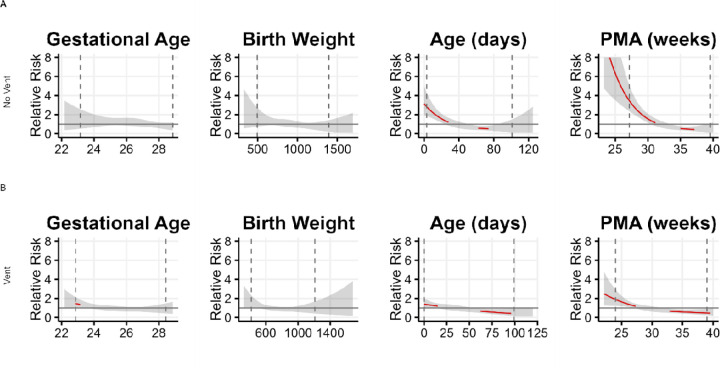
Figure 1. Sepsis risk based on clinical predictors.
Depiction of associations of predictors in each univariate logistic regression model for times (A) off- ventilator (No Vent) and (B) on-ventilator (Vent). Each tile is a plot of the relative risk of sepsis as a function of the predictor across its range, where 1 on the y-axis indicates risk equal to the overall sepsis event rate. The event rate for on-ventilator times was 0.0188 and for off-ventilator times was 0.0036. The translucent ribbon represents the 95% confidence interval. The vertical dashed lines indicate the 2.5 and 97.5 percentile of data. The red line highlights the range where the confidence intervals do not include 1. In these ranges, the variable can be considered a predictor of significantly increased sepsis risk. The major finding is increased sepsis risk at lower PMA.

