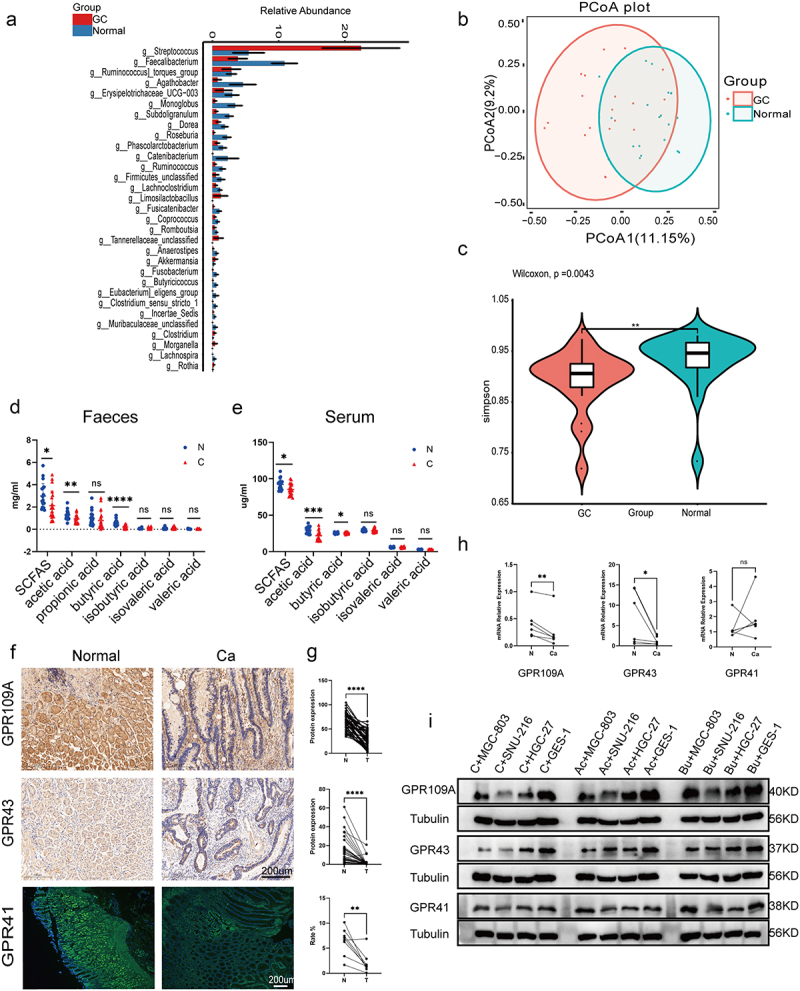
Figure 1.

(a) Differential analysis of microbial community composition in feces at the genus level between gastric cancer (GC) patients (GC, n = 20) and healthy individuals (Normal, n = 20). Differential analysis was performed on all species at each level, with the bar graph showing the top 30 species with p-values <0.05 and including differential species. Differential species were shown on the x-axis (arranged in order of abundance from left to right) and the y-axis indicated relative abundance. Bar heights indicated relative abundance of species in the different groups. (b) PCoA 2D plot: the green represented Normal and the red performed GC, and the closer the samples were, the more similar their microbial community structured, indicating less variation. (c) Violin plot: the p-value in the upper left corner represented the results of the rank-sum test for GC and Normal groups in the plot. * significant difference, ** highly significant difference, ns, non-significant difference. (d-e) GC-MS analysis of SCFA contents, including acetic, propionic, butyric, isobutyric, valeric, and isovaleric acids, in the feces (D) and serum (E) of GC patients (n = 20) and healthy individuals (n = 20). (f-g) Immunohistochemical and immunofluorescence analysis of levels of GPR109A, GPR43, and GPR41 in cancer and adjacent tissues from GC patients (n = 50 to 60 pairs). (h) mRNA expression of GPR109A, GPR43, and GPR41 in tumor and control tissues from GC patients (n = 6 pairs). (i) Western blotting of SCFA receptors (GPR109A/GPR43/GPR41) in GES-1 and GC cell lines MGC-803, HGC-27, and SNU-216, together with changes in expression after 10 mM Ac and 5 mM Bu treatment. Data indicate the mean ± SD. *p < .05, **p < .01, and ***p < .001, by 2-tailed Student’s t test or one-way ANOVA. Mann-Whitney U test was used for differential comparison of two groups of samples with biological replicates; Kruskal-Wallis test was used for comparison of multiple groups of samples with biological replicates. p < 0.05 was considered statistically significant.
