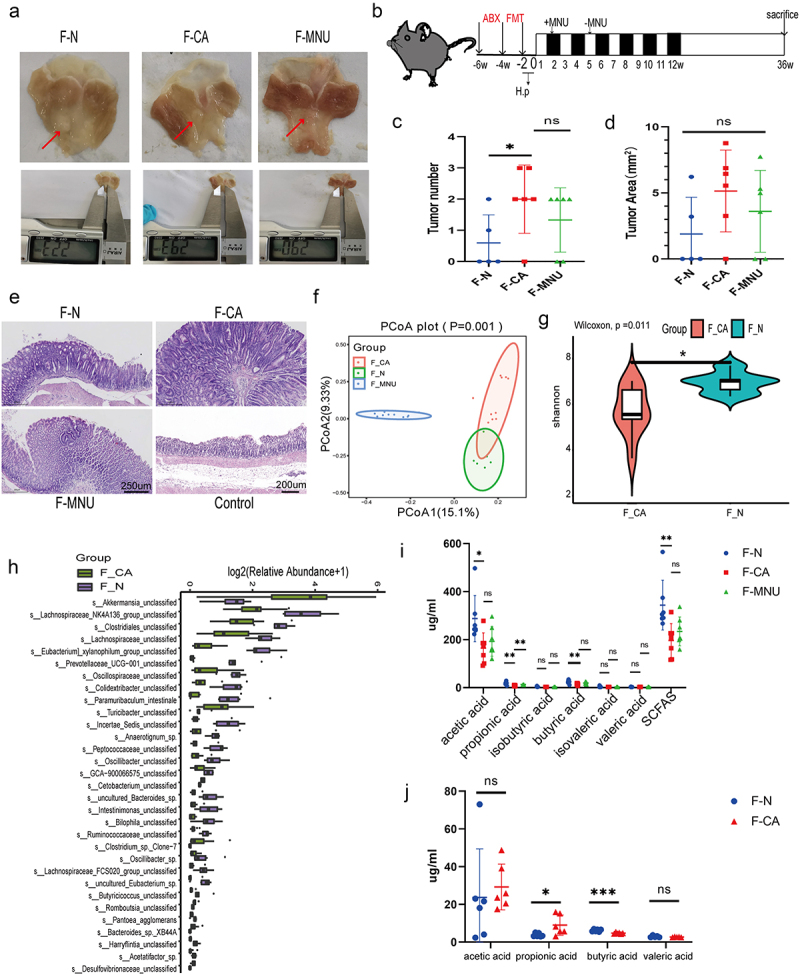
Figure 2.

ABX mouse transplantation of GC patients and normal individuals’ fecal microbiota was induced GC with H. pylori SS1+MNU treatment. Groups: mice transplanted with normal human microbiota (F-N), GC microbiota (F-CA), pbs (F-MNU), and mice without induction and treatment (Control) (−6 + 36 w). (a) Macroscopic observation of GC induction at − 6 + 36 weeks after fecal microbiota transplantation. (b) Illustration depicting microbiota transplantation in conjunction with the gastric cancer induction model. (c-d) the number and maximum volume of induced tumors were observed in the three groups (F-N, F-CA, F-MNU). (e) HE staining of mouse gastric tissue in the three groups. (f)PCoA 2D plot of there groups: the green: F-N, the blue: F-MNU, the red: F-CA, the dots were, the more similar their microbial community structured, indicating less variation. The microbial compositional structures in feces exhibited disparities between the two groups. (g) Violin plot: the p-value in the upper left corner represents the results of the rank-sum test for F-N and F-CA groups in the plot. (h) Differences in microbiota species between F-N and F-CA. Species were shown on the x-axis (arranged according to abundance from left to right) and relative abundance on the y-axis. Bar heights represented abundance of species in the different groups. n = 10 mice/group, but F-N = 6. (i-j) GC-MS analysis of the SCFA contents in feces (I) and sera (J) of mouse transplantation groups (F-N, F-CA, F-MNU). n = 5 to 6 mice/group, cages = 2 to 3/group. Data indicate the mean ± SD. *p < .05, **p < .01, and ***p < .001, by 2-tailed Student’s t test or one-way ANOVA. Mann-Whitney U test was used for differential comparison of two groups of samples with biological replicates; Kruskal-Wallis test was used for comparison of multiple groups of samples with biological replicates. p < .05 was considered statistically significant.
