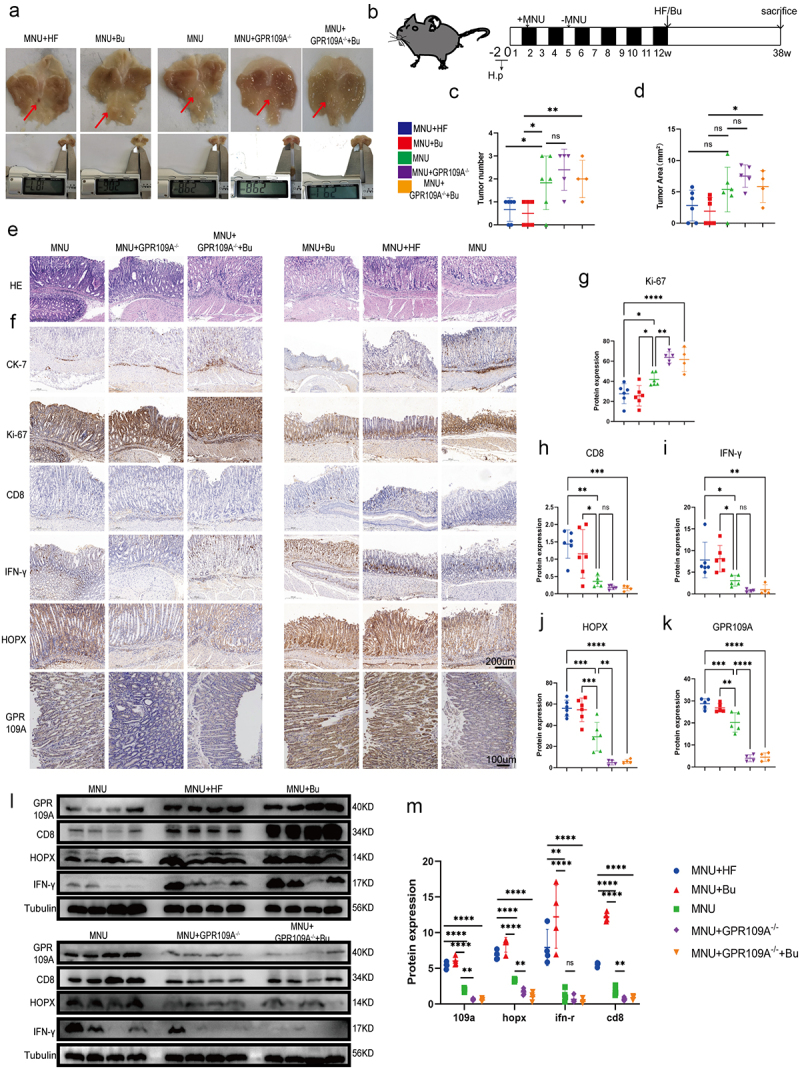
Figure 5.

At week 12 following the induction of GC with H. pylori SS1+MNU, wild-type and GPR109A−/− mice were supplemented with either Bu or a high-fiber diet (HF) until week 38 (−2 + 38 w). Tissue samples were collected from the mice in the different groups, including the wild-type group supplemented with high-fiber diet (MNU+HF), the wild-type group supplemented with Bu in the drinking water (Mnu+bu), the wild-type group (MNU), the GPR109A−/− group (MNU+GPR109A−/−), and the GPR109A −/− group supplemented with Bu in the drinking water (MNU+GPR109A−/−+Bu). (a-b) the gross morphology of the stomachs, (c) tumor numbers, and (d) maximum tumor volumes in the mice were recorded for the five groups. (e) HE staining was used to observe the morphological characteristics of mouse gastric tissues in each group. (f) immunohistochemistry was used to detect differences in the protein expression of tumor-related markers Ki-67 and CK-7, as well as GPR109A, HOPX, CD8, and IFN-γ for the five groups. (g-k) Quantification of the results of (F). (l) Differences in the expression of GPR109A, HOPX, CD8, and IFN-γ detected by Western Blotting in GC tumors. (m) Quantification of the results of (L). n = 4 to 6 mice/group, cages = 2 to 3/group, cages = 2 to 3/group. Data indicate the mean ± SD. *p < .05, **p < .01, and ***p < .001, by 2-tailed Student’s t test or one-way ANOVA.
