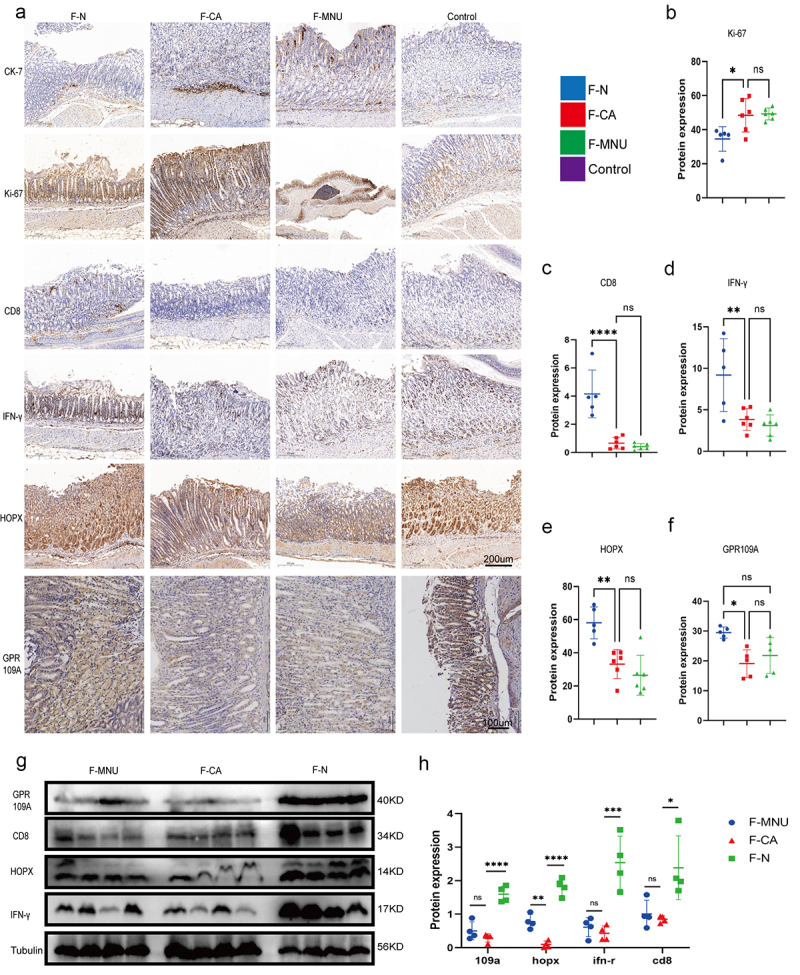
Figure 7.

Groups: mice transplanted with normal human microbiota (F-N), GC microbiota (F-CA), pbs (F-MNU), and mice without induction and treatment (Control) (−6 + 36 w). (a) Immunohistochemical analysis of levels of the tumor-related indicators Ki-67 and CK-7 protein in gastric tissue of each group, together with the differential expression of GPR109A, HOPX, CD8, and IFN-γ proteins. (b-f) Quantification of the results of (A). (g) Western blotting of GPR109A, HOPX, CD8, and IFN-γ proteins in gastric tumor tissue of the different groups. (h) Quantification of the results of (G). n = 5 to 6 mice/group, cages = 2 to 3/group, cages = 2 to 3/group. Data indicate the mean ± SD. *p < .05, **p < .01, and ***p < .001, by 2-tailed Student’s t test or one-way ANOVA.
