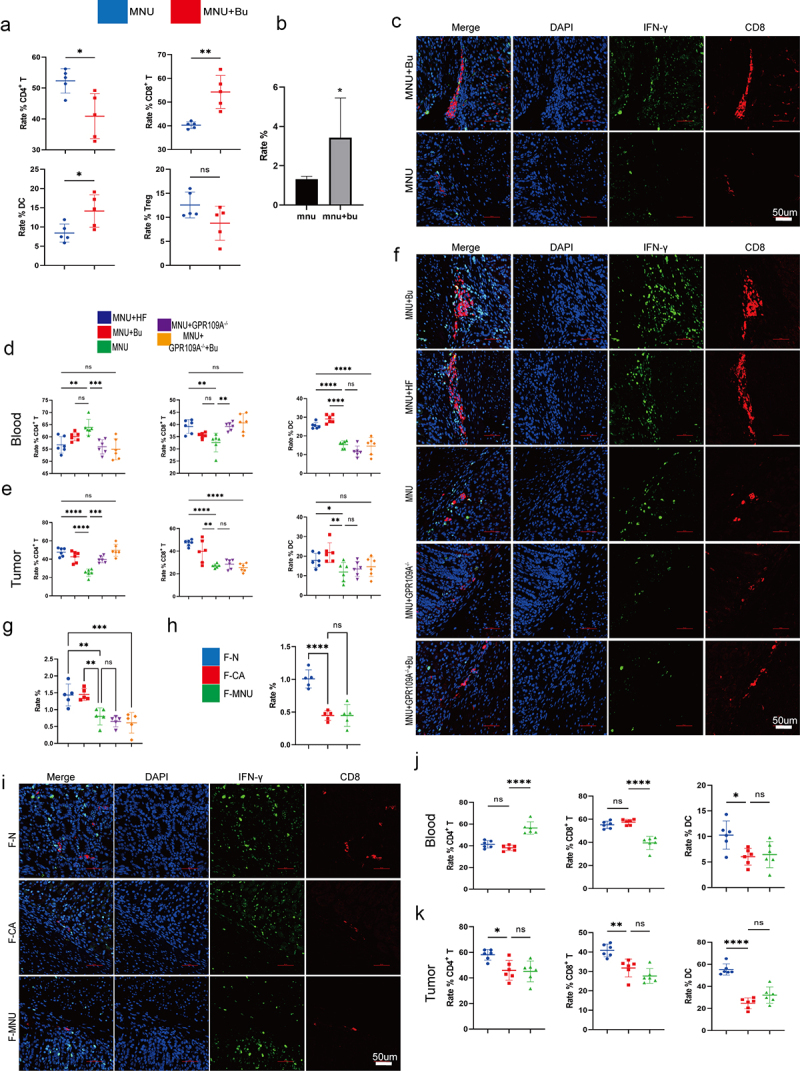
Figure 8.

(a) Flow cytometry analysis of the proportions of CD3+ T, CD4+ T, CD8+ T, CD25+ FOXP3+ Treg cells, and DCs cells in mouse peripheral blood in the MNU and MNU+Bu groups (−2 + 52 w). (b) Quantitative statistical analysis of the fluorescence colocalization of (c). Positive cell rate (%). (c) Immunofluorescence staining showing the co-expression of CD8 and IFN-γ in the two groups. (d-e) Flow cytometry analysis of the proportions of DCs and CD3+ T, CD4+ T, and CD8+ T cells in mouse gastric tumor tissues and peripheral blood in the different groups (MNU+HF, MNU+Bu, MNU, MNU+GPR109A−/−, MNU+GPR109A−/−+Bu) (−2 + 38 w). (f) The co-expression of CD8 and IFN-γ in the five groups. (g) Quantitative statistical analysis of the fluorescence colocalization of (F). Positive cell rate (%). (h) Quantitative statistical analysis of the fluorescence colocalization of (I). Positive cell rate (%). (i) The co-expression of CD8 and IFN-γ in the groups (F-N, F-CA, F-MNU) (−6 + 36 w). (j-k) Flow cytometry analysis of the proportions of DCs and CD3+ T, CD4+ T, and CD8+ T cells in mouse gastric tumor tissues and peripheral blood in the three (F-N, F-CA, F-MNU) groups. n = 4 to 6 mice/group, cages = 2 to 3/group, cages = 2 to 3/group. Data indicate the mean ± SD. *p < .05, **p < .01, and ***p < .001, by 2-tailed Student’s t test or one-way ANOVA.
