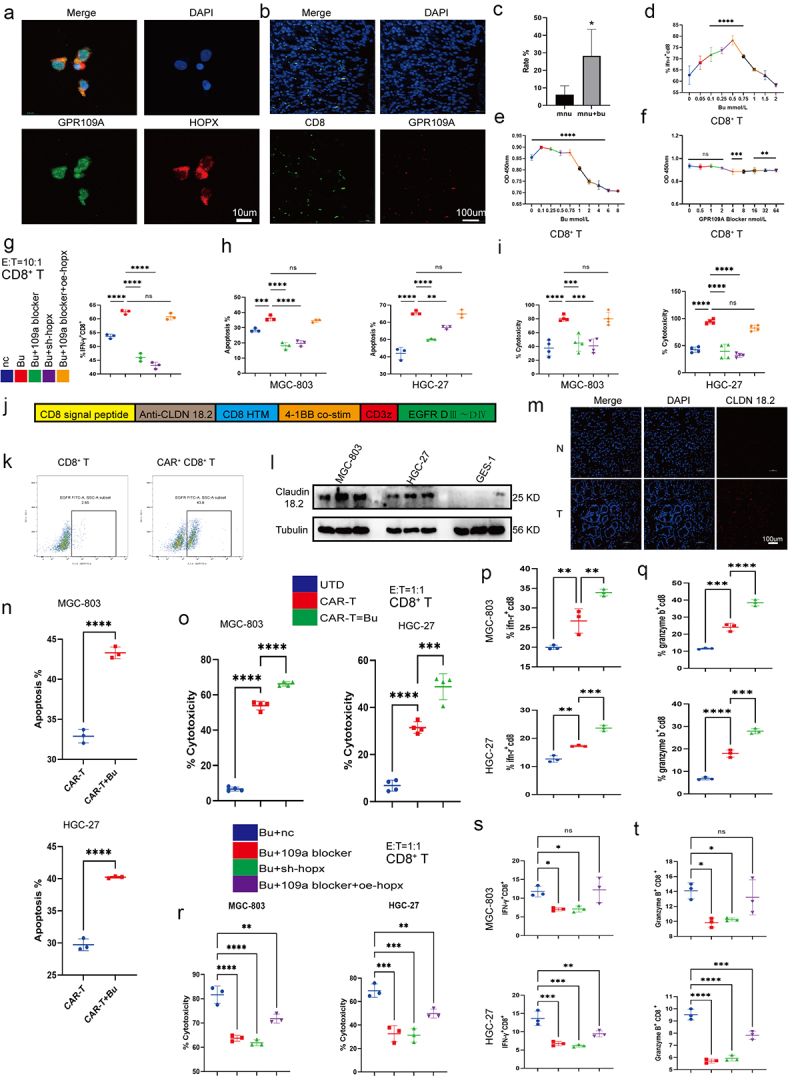
Figure 9.

(a) Co-localization of GPR109A and HOPX proteins in CD8+ T cells. (b-c) Co-localization of CD8 and GPR109A shown by immunofluorescence in mouse gastric tissue in the MNU and MNU+Bu groups (−2 + 52 w). (d) Changes in the proportion of IFN-γ positive cells in the CD8+ T cell group after treatment with different concentrations of Bu. (e-f) Changes in the proliferation of CD8+ T cells after treatment with different concentrations of Bu (e) or GPR109A inhibitors (f). (g) Changes in the proportion of IFN-γ-positive CD8+ T cells after treatment with Bu together with GPR109A inhibitors, HOPX knockdown, or HOPX overexpression. (h-i) Changes in the apoptotic rates (h) and the altered cytotoxicity (i) of tumor cells induced by CD8+ T cells after treatment with Bu together with GPR109A inhibitors, HOPX knockdown, or HOPX overexpression, co-cultured with MGC-803 or HGC-27. (j) Simplified diagram of CAR-claudin18.2 sequence. (k) Infection efficiency of primary CD8+ T cells by CAR-claudin18.2 lentivirus. (l) Differences in the level of Claudin 18.2 proteins in HGC-27, MGC-803 and GES-1 cells detected by western blotting. (m) Fluorescence images showing claudin18.2 protein expression in GC tumor tissue and adjacent tissue. (n-q) groups: UTD, CAR-T, CAR-T+Bu. (n) Apoptosis rate of GC cells MGC-803 or HGC-27 after co-cultivation with CAR-claudin18.2+ CD8+ T cells or combined with Bu. (o) Cytotoxicity of CAR-claudin18.2+ CD8+ T cells or combined with Bu against MGC-803 or HGC-27 gastric cancer cells. (p-q) Flow cytometry analysis of IFN-γ and Granzyme B positive expression in CAR-claudin18.2+ CD8+ T cells after co-cultivation with MGC-803 or HGC-27 GC cells, either alone or combined with Bu. (r-t) groups: Bu+nc, Bu + 109a blocker, Bu+sh-hopx, Bu + 109a blocker+oe-hopx. (r) The altered cytotoxicity of GC cells induced by CAR-claudin18.2+ CD8+ T cells after treatment with Bu together with GPR109A inhibitors, HOPX knockdown, or HOPX overexpression, co-cultured with MGC-803 or HGC-27. (s-t) Changes in the proportion of IFN-γ+ or Granzyme B+ CAR-claudin18.2+ CD8+ T cells after the same treatment (r). Data indicate the mean ± SD. *p < .05, **p < .01, and ***p < .001, by 2-tailed Student’s t test or one-way ANOVA.
