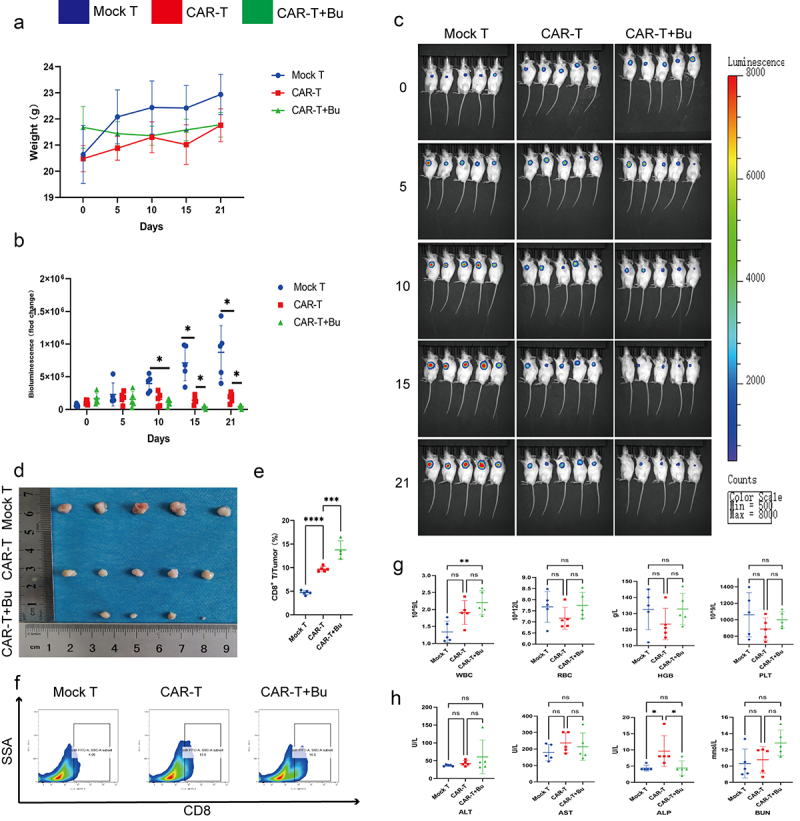
Figure 10.

CAR-claudin18.2+ CD8+ T cells were administered in conjunction with 0.5 mmol/L Butyrate for the treatment of subcutaneous MGC-803 tumors. groups: Mock T, CAR-T, CAR-T+Bu. (a) Analysis of body weight fluctuations. (b) Live imaging statistical analysis of (C). (c) In vivo imaging conducted on days 0, 5, 10, 15, and 21. (d) Tumor size was measured after 23 days of treatment. (e-f) Flow cytometry analysis revealed the proportion of CD8+ T cells within the tumor. (g) Hematological analysis showed variations in WBC, RBC, HGB, and PLT. (h) Blood biochemistry examination reflected changes in ALT, AST, ALP, and BUN levels. The data represent the mean ± SD. *p < .05, **p < .01, and ***p < .001, as determined by a two-tailed Student’s t-test or one-way ANOVA.
