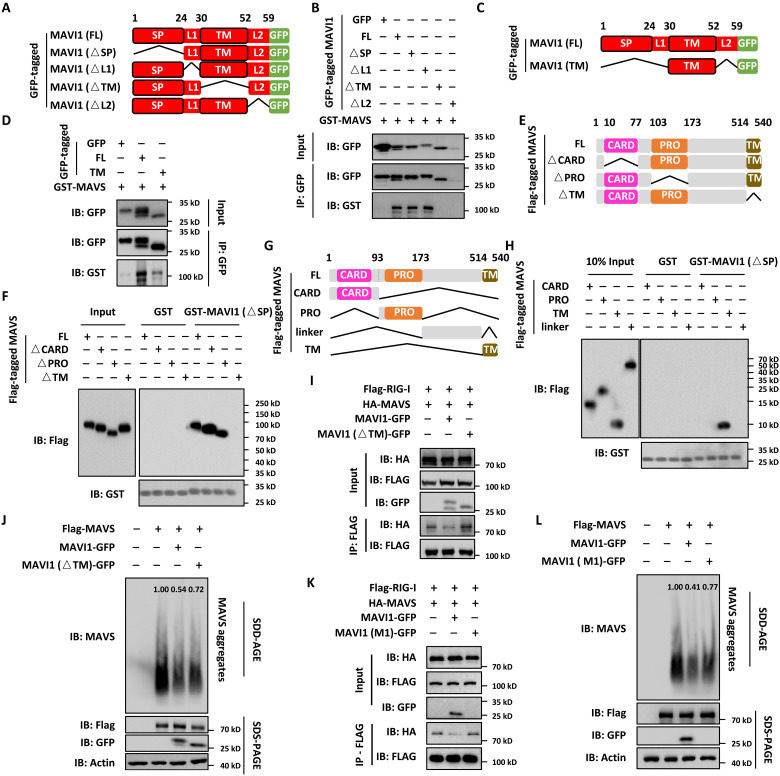
Fig. 6. MAVI1 interacts with MAVS through the TM domain.
(A) Schematic representation of GFP-tagged, full length (FL), SP-deleted (△SP), linker region 1–deleted (△L1), TM domain–deleted (△L2), and linker region 2–deleted (△L2) MAVI1 is shown. (B) In vitro pull-down assay was performed by mixing GFP-tagged proteins purified from HEK293 cells as shown in (A) and purified, bacterially expressed GST-tagged MAVS. (C) Schematic representation of GFP-tagged MAVI1 (FL) and the TM domain only (TM) is shown. (D) In vitro pull-down assay was performed by mixing GFP-tagged proteins purified from HEK293 cells as shown in (C) and purified, bacterially expressed GST-tagged MAVS. (E) Schematic representation of Flag-tagged, MAVS (FL), caspase recruitment domain-deleted (△CARD), proline rich domain-deleted (△PRO), and TM domain–deleted (△TM) MAVS is shown. (F) In vitro pull-down assay was performed by mixing Flag-tagged proteins purified from HEK293 cells as shown in (E) and purified, bacterially expressed GST-tagged MAVS (△SP). (G) Schematic representation of Flag-tagged, MAVS (FL), CARD only (CARD), PRO only (PRO), unknown region only (unknown), and TM domain only (TM) is shown. (H) In vitro pull-down assay was performed by mixing Flag-tagged proteins purified from HEK293 cells as shown in (G) and purified, bacterially expressed GST-tagged MAVS (△SP). (I) HEK293 cells transfected with vectors as indicated were subjected to IP analysis. (J and L) Cell lysates from HEK293 cells transfected with vectors as indicated were resolved by SDD-AGE (top) and SDS-PAGE (bottom three) gel. The intensity of MAVS aggregates was quantified by ImageJ. (K) HEK293 cells transfected with vectors as indicated were subjected to IP analysis.

