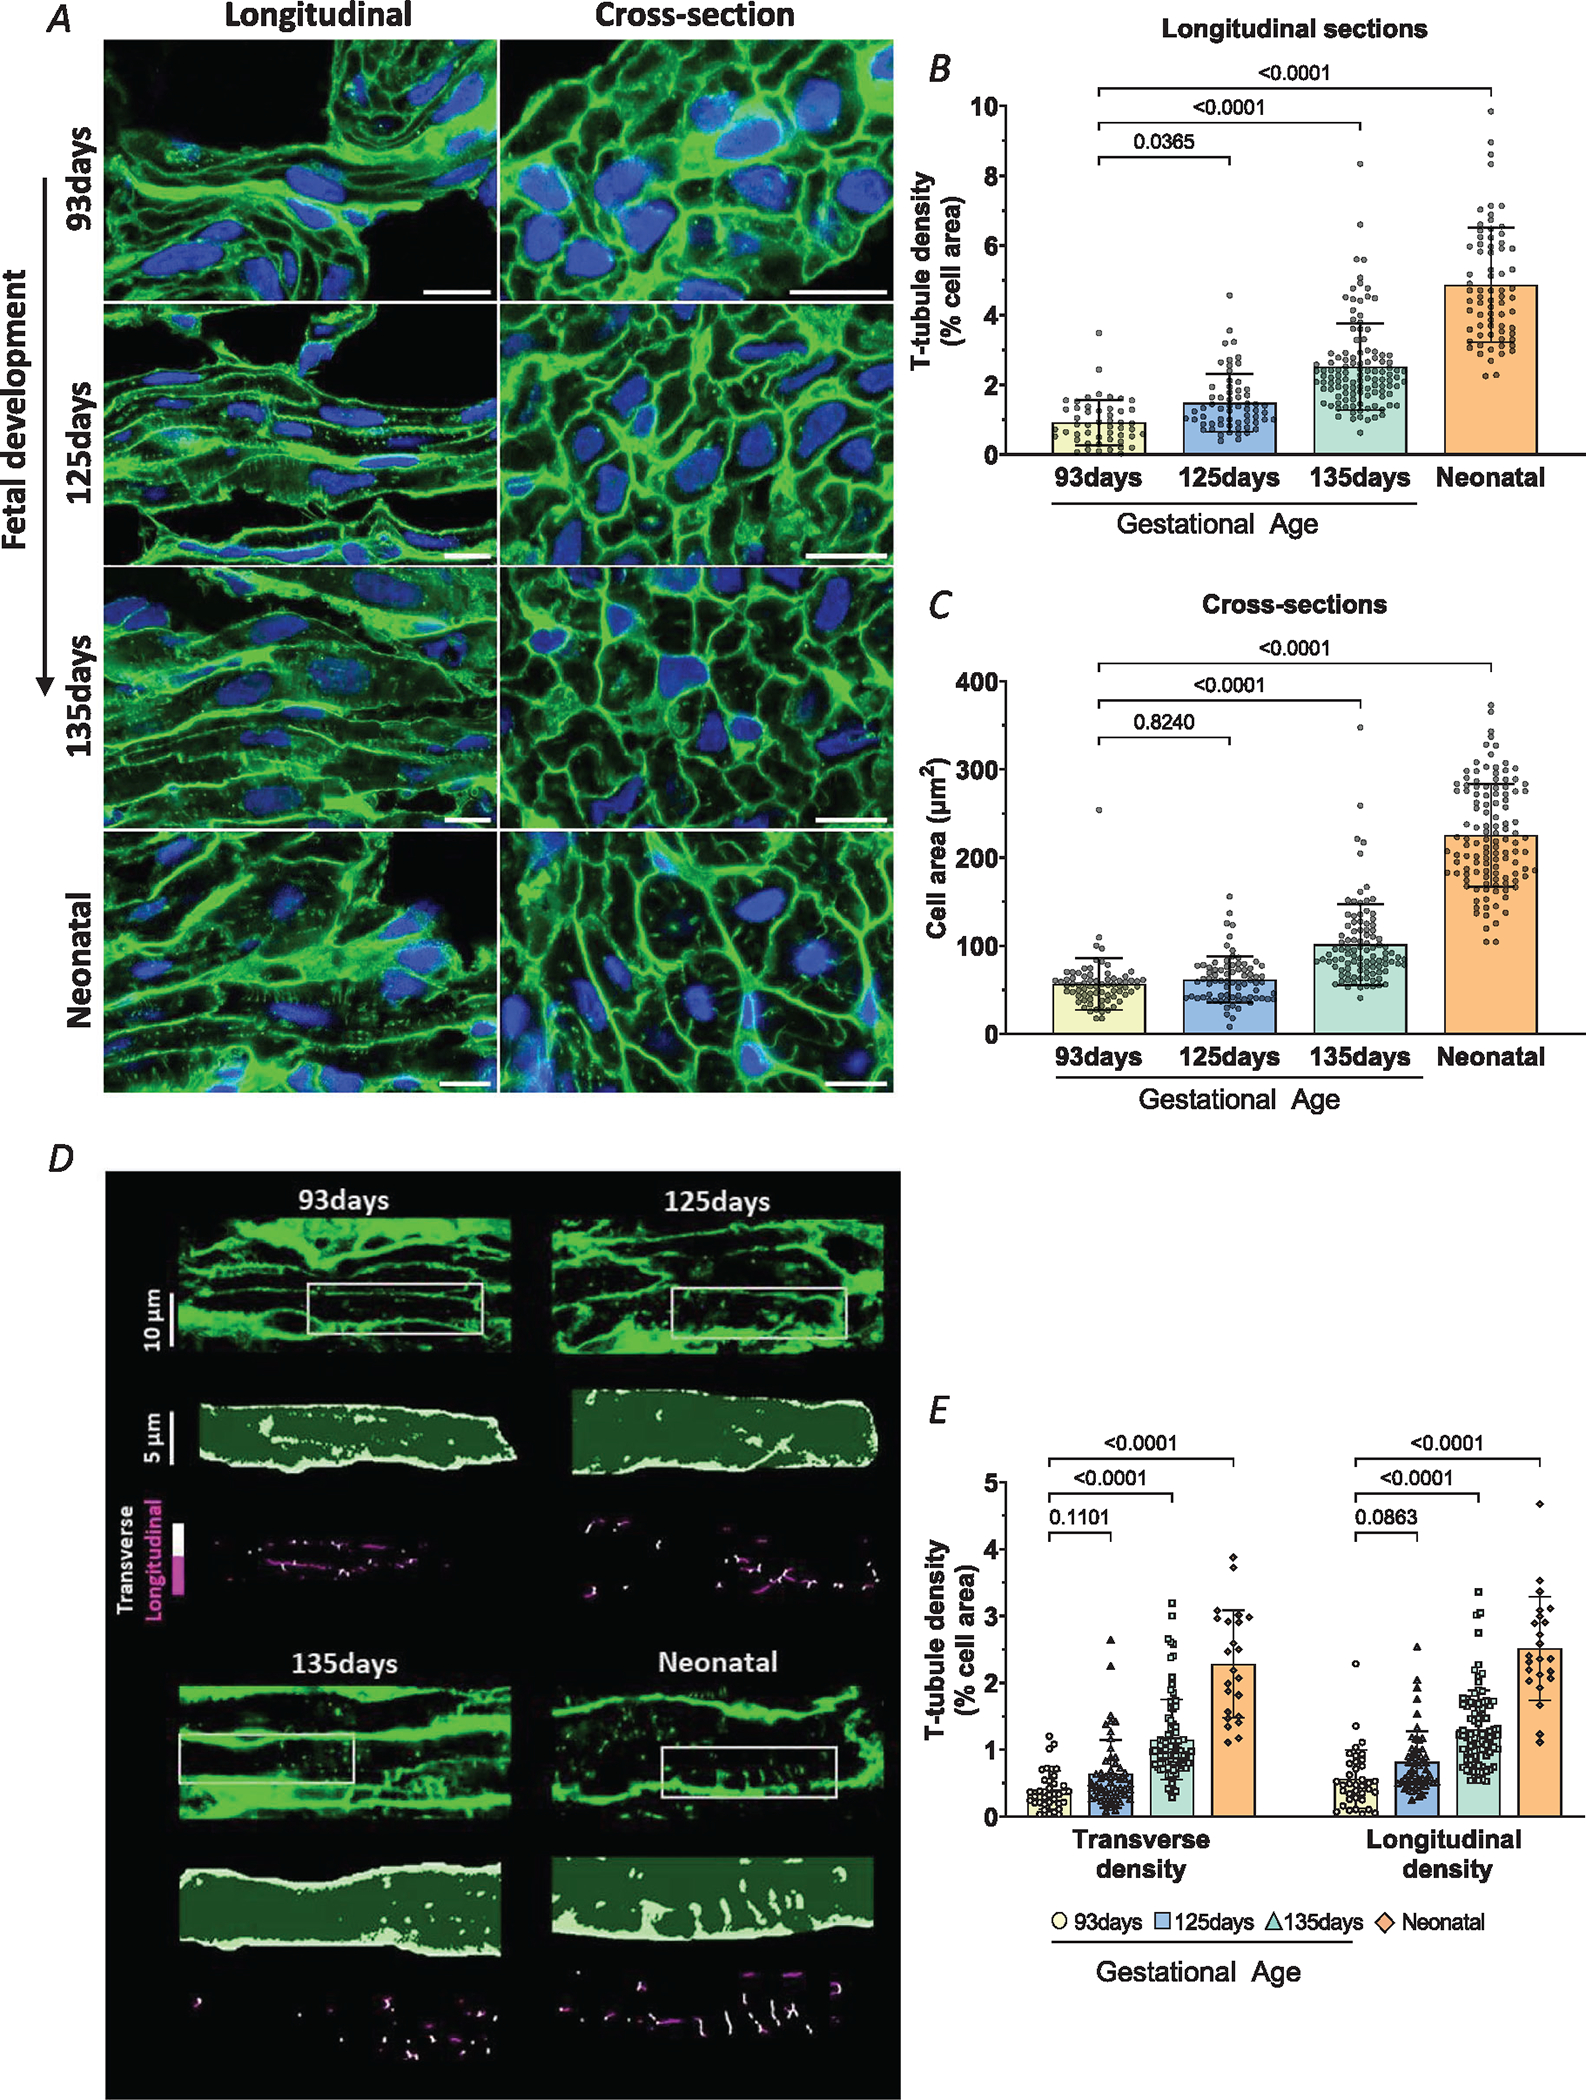
Figure 1. Time course of t-tubule formation and cardiomyocyte hypertrophy during development.

A, representative super-resolution Airyscan micrographs of t-tubules (WGA, green), and nuclei (DAPI, blue) in left ventricular myocardium from fetal (gestational ages 93, 125 and 135 days) and neonatal (8–9 days) sheep. Longitudinal and transverse sections are displayed in the left and right panels, respectively (scale bars = 10 μm). B, quantification of t-tubule signals indicated a gradual increase in density through the fetal and early neonatal periods. C, cell growth followed a somewhat later time course. D, detailed analysis of transverse and longitudinal t-tubule structures was performed in a subset of images. Representative images are presented with indicated regions enlarged and skeletonized below, with colour coding of transverse and longitudinal tubules. E, quantification of these signals revealed roughly parallel increases in the density of transverse and longitudinal t-tubule densities during maturation. Data are presented as means ± SD, with P-values indicated. Statistical comparisons were made using 1-way ANOVA versus 93 days, with Dunnett’s multiple comparison test (B, C) or 2-way ANOVA with Šidák’s Multiple comparison test (E). Number of cells (animals): t-tubule density: 93 days 50 (4), 125 days 62 (4), 135 days 114 (5), neonatal 72 (5); cell area: 93 days 73 (4), 125 days 77 (4), 135 days 99 (5), neonatal 120 (5); transverse and longitudinal densities: 93 days 37 (4), 125 days 53 (4), 135 days 87 (4), neonatal 23 (3).
