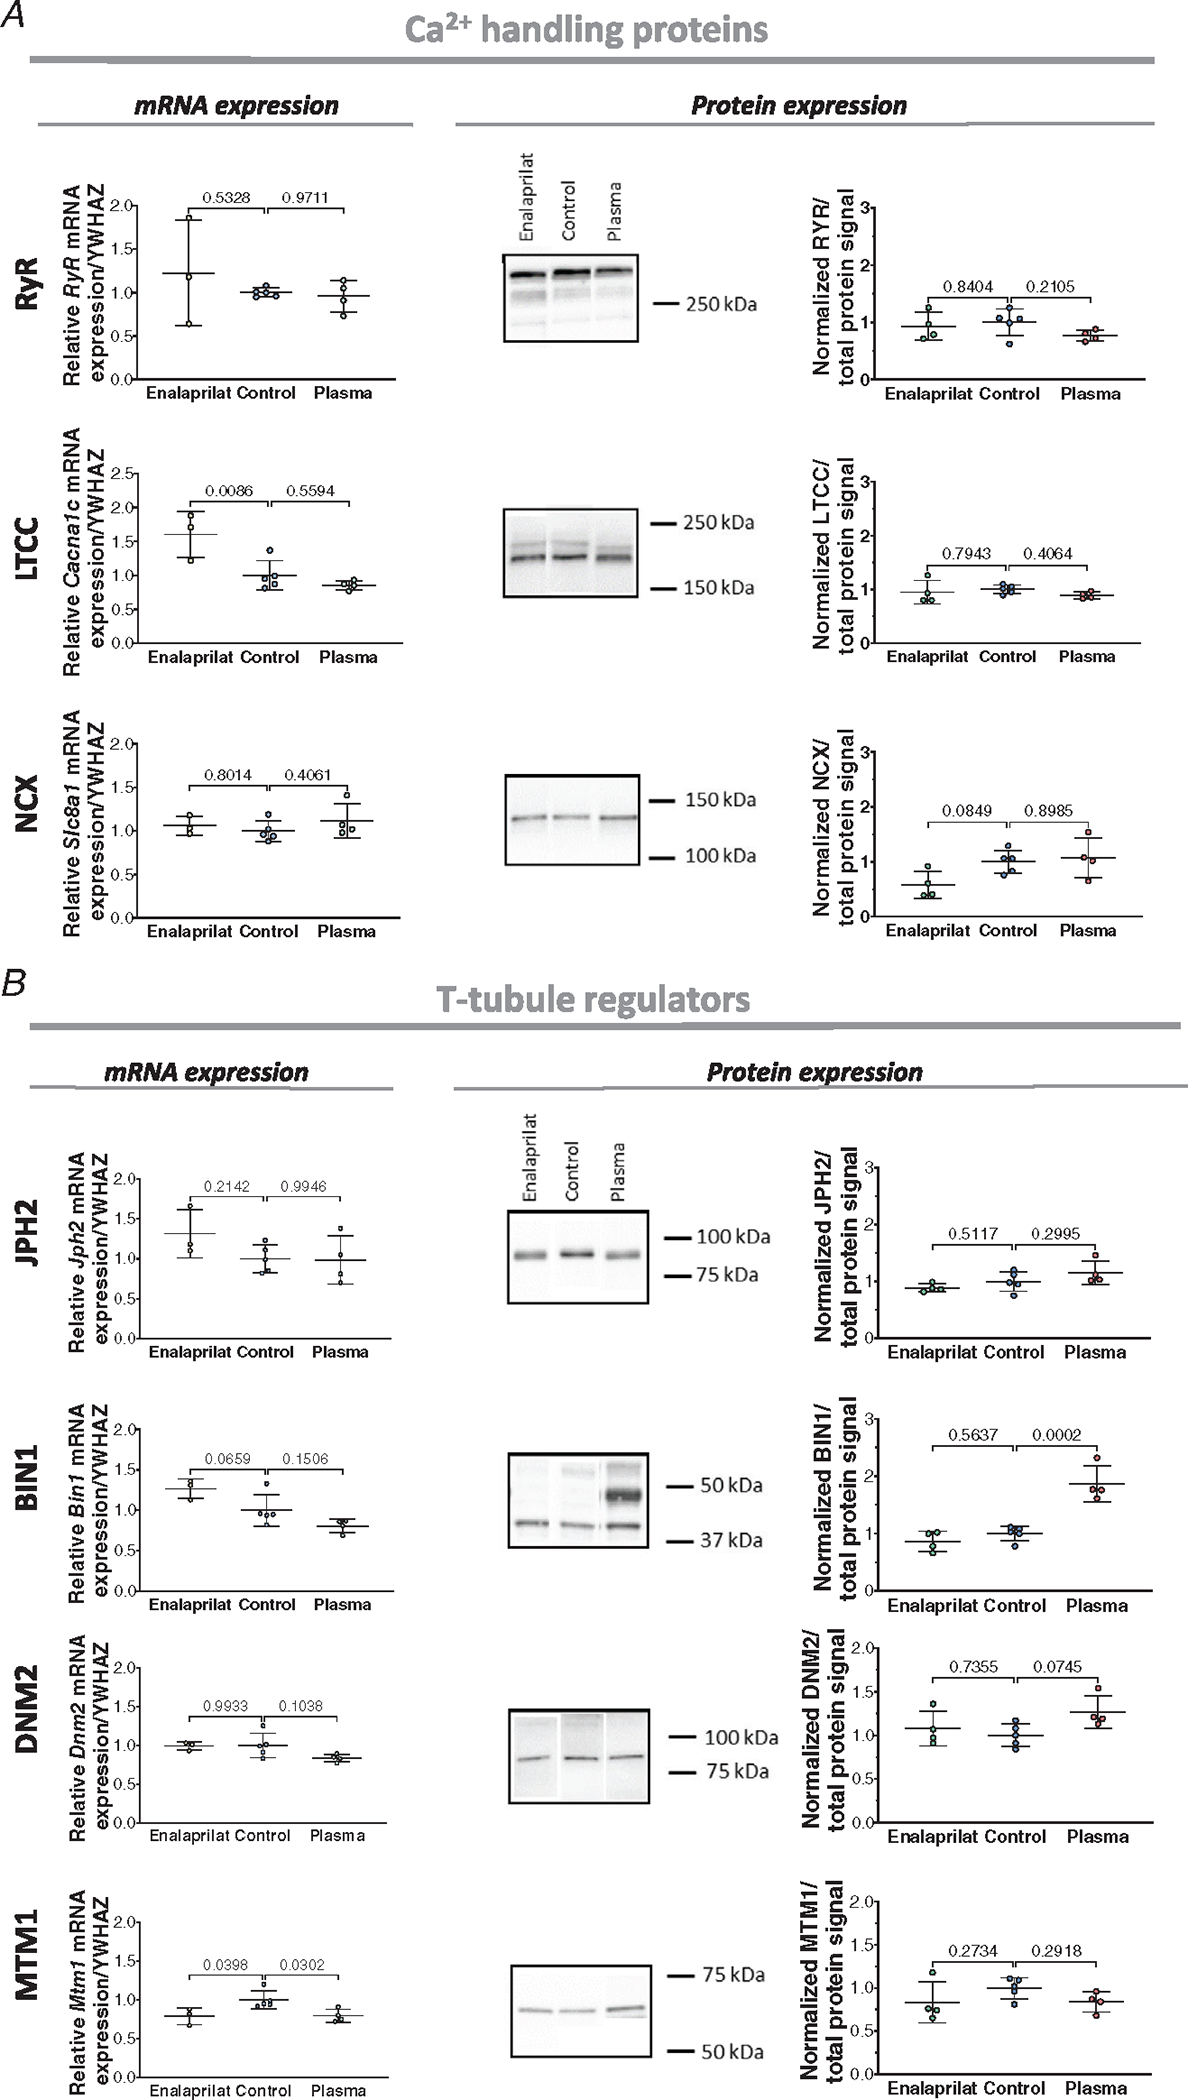
Figure 5. Left ventricular expression of dyadic Ca2+ handling proteins and t-tubule regulators in the infusion animal model.

A, expression of RyR, LTCC and NCX in enalaprilat, control and plasma-infused hearts at the mRNA (left panels) and protein level (right panels; with representative blots). B, expression of the t-tubule regulators JPH2, BIN1, DNM2 and MTM1 in the three experimental groups at the mRNA (left panels) and protein levels (right panels). Data are presented as means ± SD, with P-values indicated. Statistical comparisons vs. control were made by 1-way ANOVA with Dunnett’s multiple comparison test. For qPCR (all genes), n = 3 hearts for enalaprilat, n = 3 for plasma, n = 5 hearts for control group. For western blots (all proteins), n = 4 hearts for enalaprilat and plasma groups, n = 5 hearts for controls.
