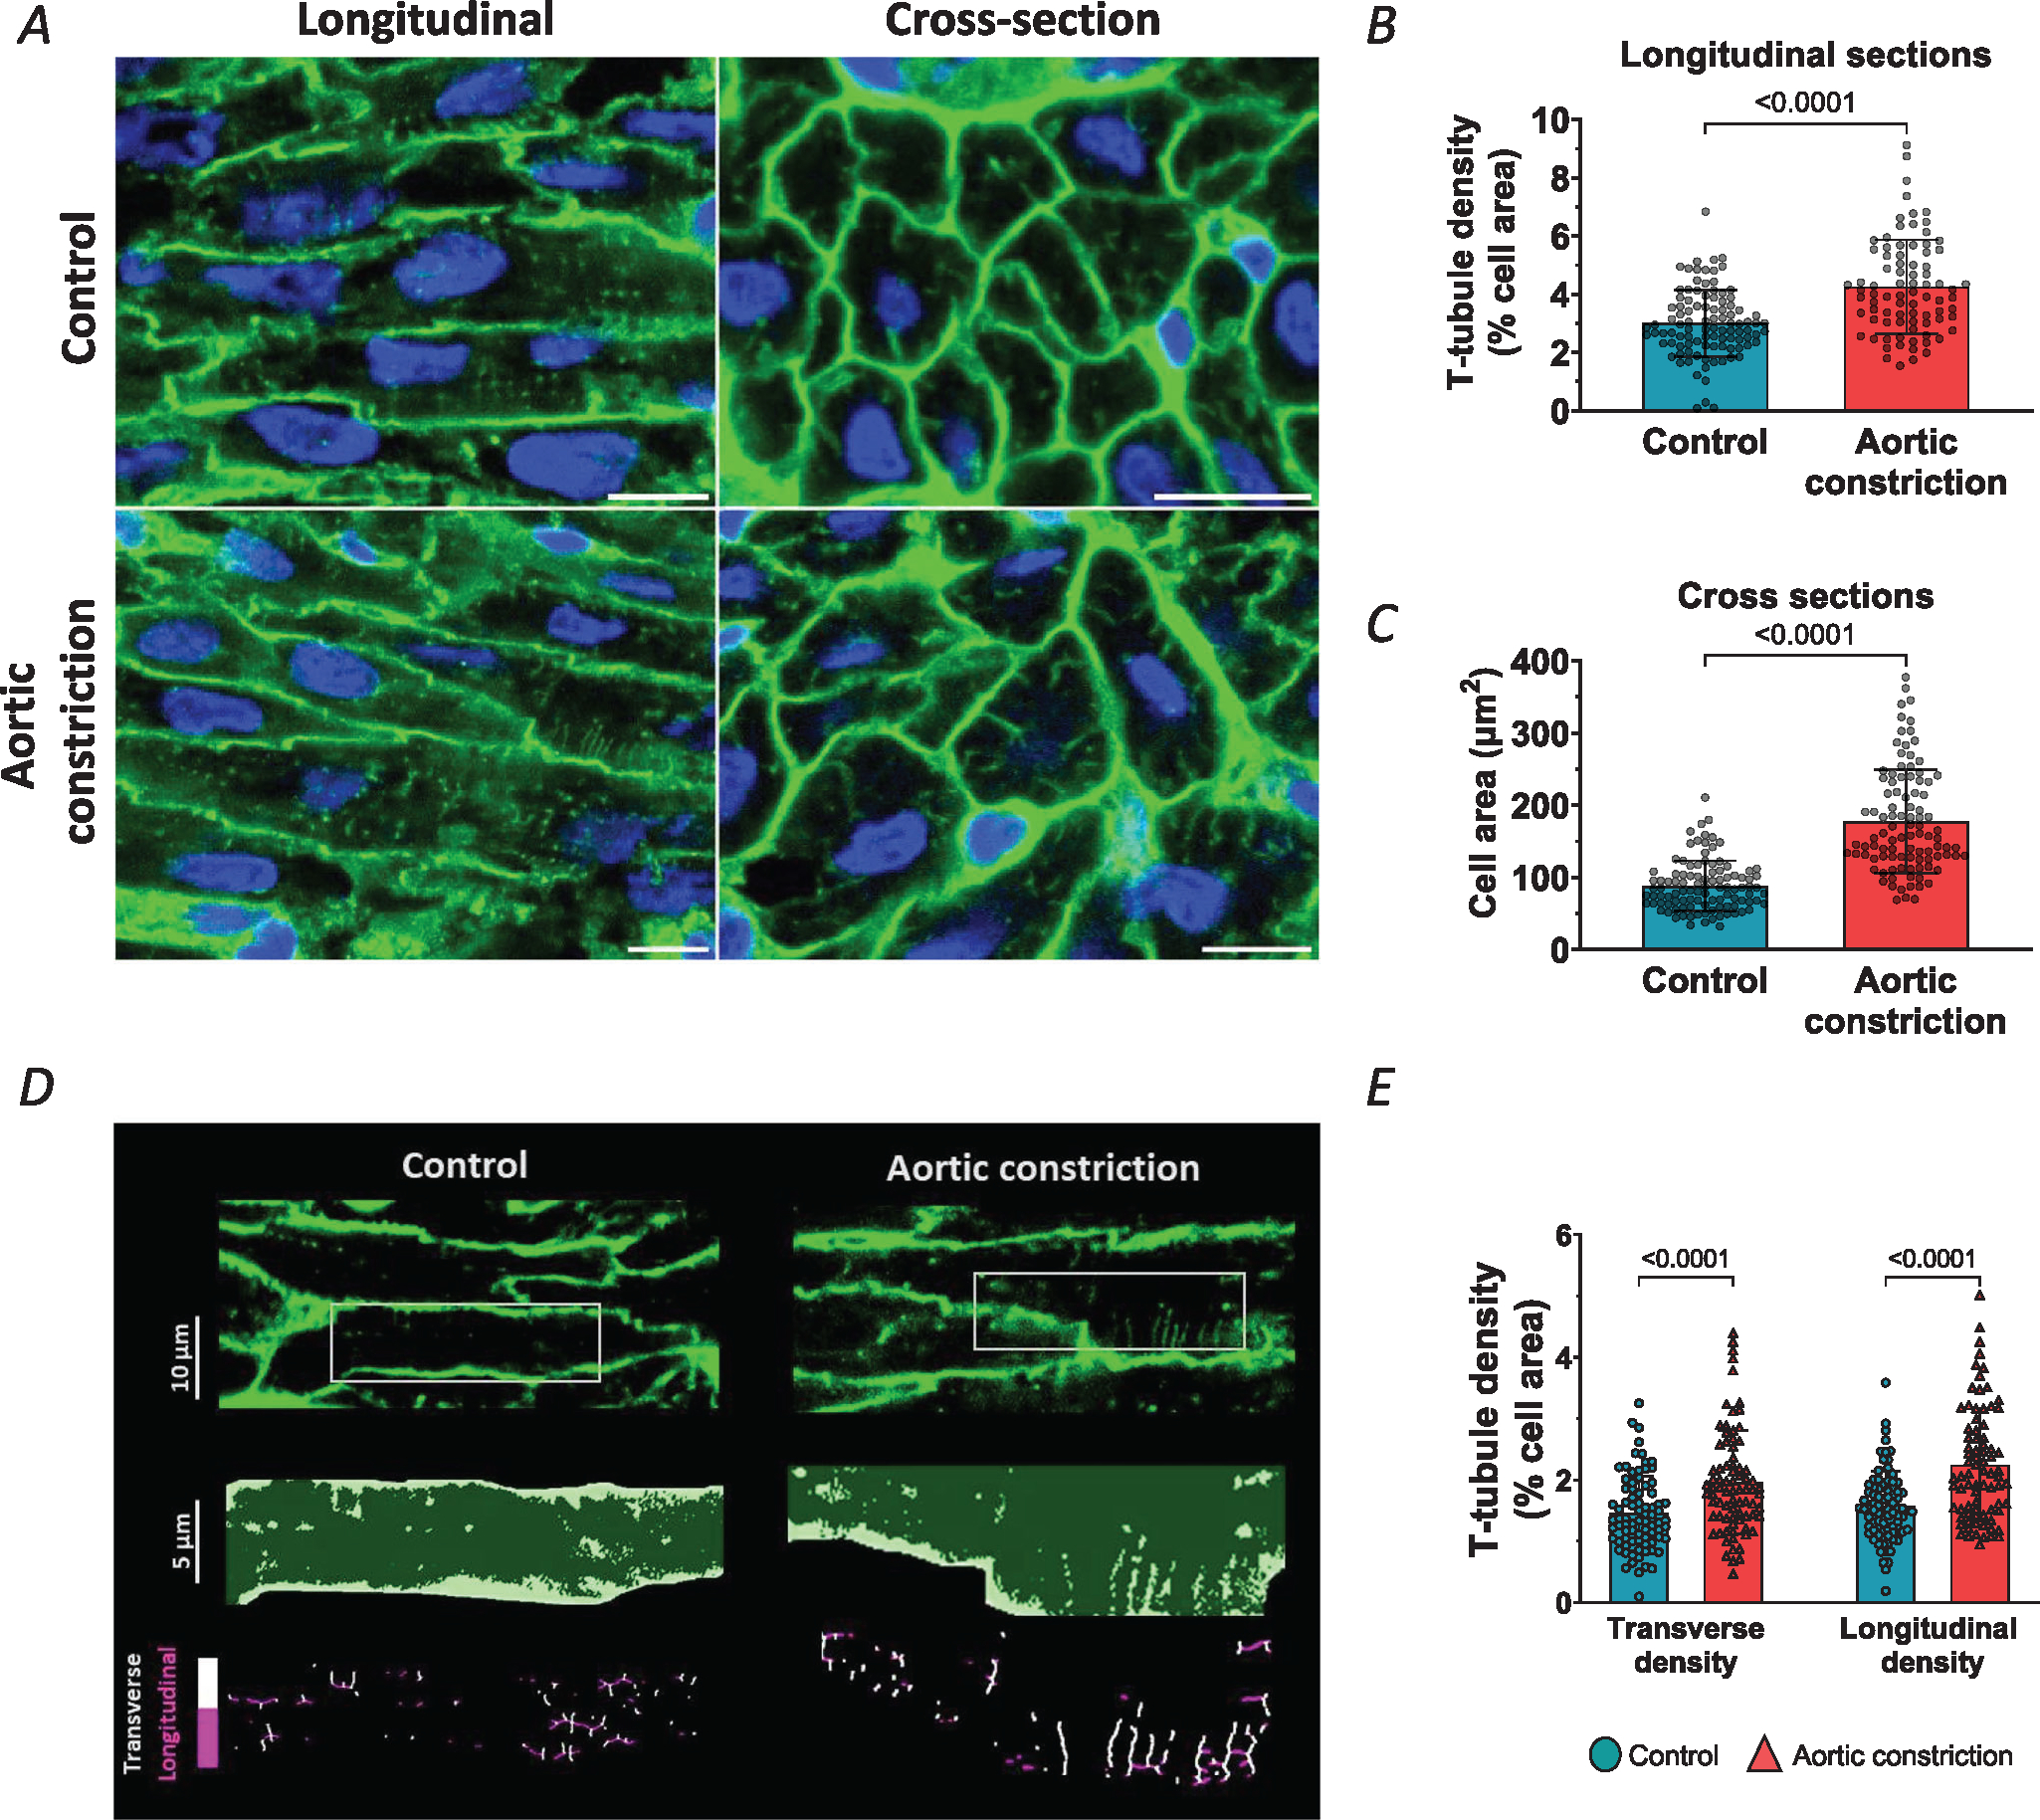
Figure 6. Increasing systolic pressure load by aortic constriction accelerates t-tubule growth.

A, representative super resolution Airyscan micrographs of t-tubules (WGA, green), and nuclei (DAPI, blue) in fetal myocardium at gestational of 135 days. Fetal sheep treated with an occluder in the post-ductal aorta (aortic constriction) were compared with control animals. Images for longitudinal and transverse sections are presented in the left and right panels, respectively (scale bars: 10 μm). B and C, aortic occlusion induced increases in mean t-tubule density (B) and cell area (C) compared to controls. D, analysis of transverse and longitudinal t-tubule structures. Representative images are presented with indicated regions enlarged and skeletonized below, with colour coding of transverse and longitudinal tubules. E, quantification of these signals revealed that aortic occlusion induced a roughly parallel increase in the density of the two types of t-tubules. Data are presented as means ± SD, with P-values indicated. Statistical comparisons vs. control were made by unpaired t test (B and C), or vs. other groups by 2-way ANOVA with Šidák’s multiple comparison test. Number of cells (animals): t-tubule density: controls 100 (5), aortic constriction 83 (4); cell area: controls 103 (5), aortic constriction 99 (4); transverse and longitudinal densities: controls 81 (5), aortic constriction 80 (4).
