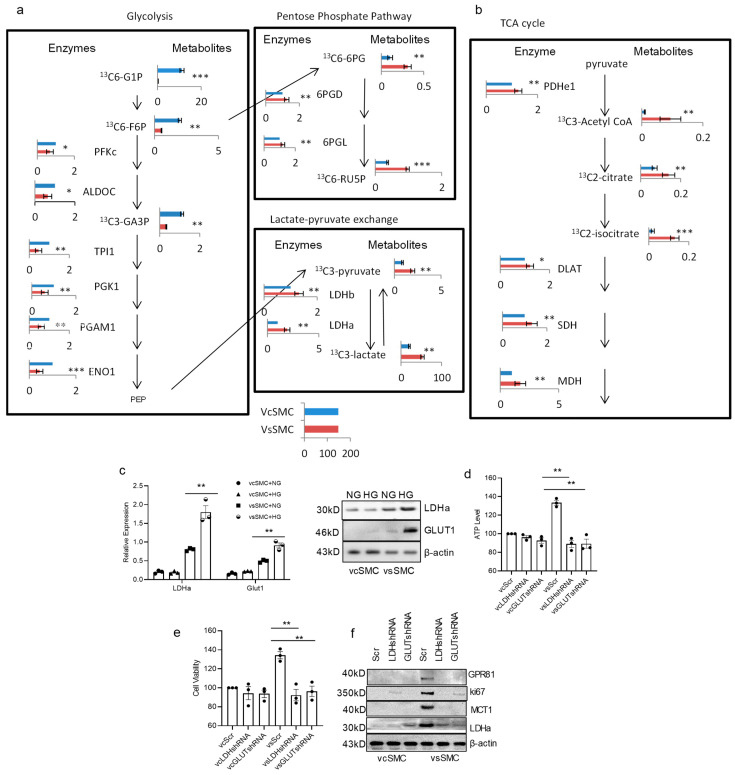
Figure 2.
vSMCs utilize glucose differently. There are distinct metabolic differences between contractile vSMCs and synthetic vSMCs in proteomics and metabolomics analyses. Metabolic pathway map summarizing only the significant results from proteomics and [13C]-labeled glucose metabolomics analyses. Cell sample treatment and handling were described in the method section. The bar graphs represent the detected levels of proteins or [13C]-labeled metabolites in synthetic vSMCs (red bar) and contractile vSMCs (blue bar). All data were obtained from independent experiments. Data present 30 min 13C pulse samples. (a) Glycolysis pathway (left panel) and lactate production (right panel) map summarizing the results from proteomics and [13C]-labeled glucose metabolomics analyses. Glycolysis activity in synthetic vSMCs was lower than contractile vSMCs but lactate production was higher in synthetic vSMCs. (b) The TCA cycle pathway map summarizing the results from proteomics and [13C]-labeled glucose metabolomics analyses. The higher enzymes and metabolites indicate that the TCA cycle activity in synthetic vSMCs was higher than in contractile vSMCs. (c) The expression of glucose transporter 1 (GLUT1) and lactate dehydrogenase a (LDHa) in vSMCs in NG and HG culture was evaluated in RT-PCR and Western blot analysis. vSMCs were transduced with LDHa, GLUT1, and scrambled shRNAs and culture for 48 h. Then, the cells were used to measure ATP production (d), proliferation with MTT kit (Roche, USA) (e), and expression of GLUT1, MCTs, and LDHa with Western blot (f) in vcSMCs and vsSMCs cultured for 24 h in HG culture medium. Knocking down LDHa and GLUT1 inhibited the ATP production, cell proliferation, and increase in MCT1, GPR81, and Ki67 in vSMCs in HG culture. All data are shown as mean ± S.E. * p < 0.05, ** p < 0.01, *** p < 0.001 for all panels.

