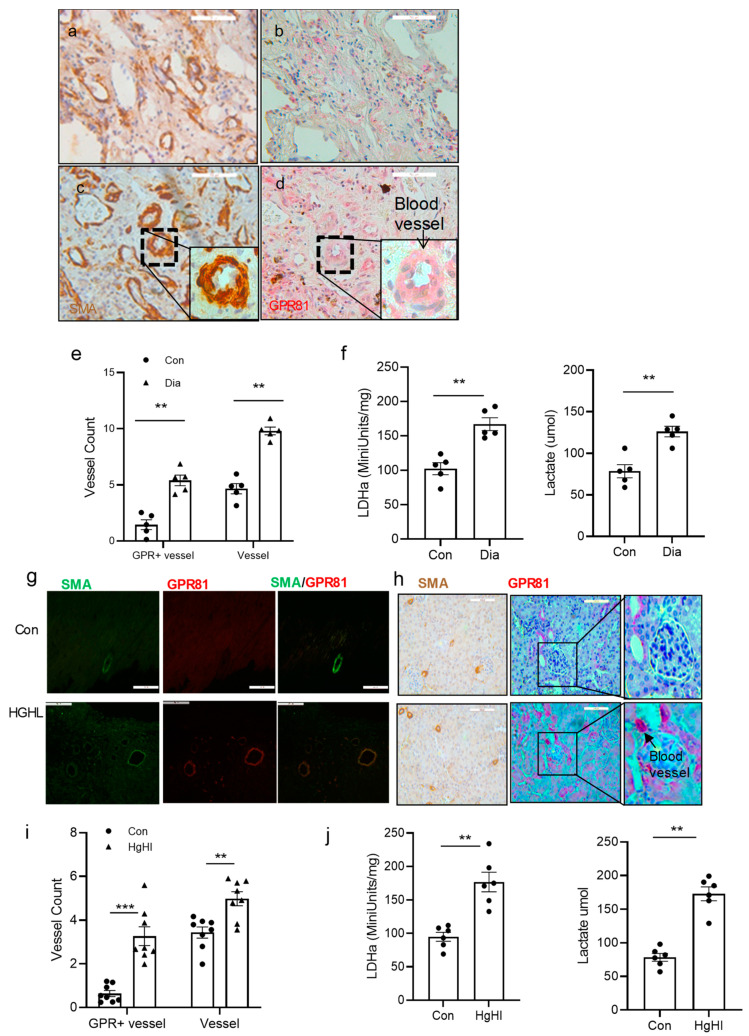
Figure 6.
GPR81 in diabetic patients and high-lipid, high-glucose diet TallyHo mice. Tissues from diabetic patients were used to analyze GPR81 expression in vSMCs and surrounding cells with immunohistochemistry (IHC). Serial 5 µm sections of human lung (a–d) were used for IHC. Diabetic lung tissues had higher blood vessel counts (SMA staining in brown, quantified with Image J Program) and GPR81 expression (red) than control tissues. (a) Control nondiabetic lung tissue stained with SMA; (b) GPR81 stain on serial section close to section (a); (c) diabetic lung tissue stained with SMA; (d) GPR81 stain on serial section close to section (c). (e) The blood vessels were counted in the above IHC slides, and the result showed that there are more blood vessels and GPR81-positive blood vessels in diabetic tissues (n = 5) than in control tissues (n = 5). A total of 4 fields (200X) from each case was counted. (f) Lung tissue lactate assay. Human lung tissue from control and diabetic patients were used to measure lactate. Diabetic lung demonstrated higher LDHa activity (left) and lactate levels (right) than the control sample. (n = 5). TallyHo mice were also used to observe if the high-glucose diet affects the blood vessels. (g,h) Tissues from TallyHo mice were used to analyze GPR81 expression in the SMCs and cells around them in immunohistochemistry analysis. (g) High-lipid, high-glucose diet promoted GPR81 expression in mouse heart tissue blood vessel SMCs. SMA staining in green and GPR81 staining in red. Scale bar = 50 µm. (h) High-lipid, high-glucose diet promoted GPR81 expression in mouse kidney tissue blood vessel SMCs. SMA staining in brown (left panel) and GPR81 staining in red. Scale bar = 100 µm. Far-right panel: enlarged kidney image (glomerulus) with blood vessel labeled. (i) The blood vessels were counted in the above IHC slides, and the result showed that there were more GPR81-positive cells in blood vessels of high-lipid, high-glucose diet mouse tissue (n = 8) than normal diet (n = 8). The Image J program was used in quantification of fluorescent density, and 4 fields (400X) were counted in each case. (j) Tissue lactate assay. TallyHo mouse heart tissue from control and high-fat, high-glucose TallyHo mice were used to measure LDH activity (left) and lactate levels (right). High-lipid, high-glucose TallyHo mice presented higher lactate levels than control group. (n = 6). Normal diet: Con; high-lipid, high-glucose diet: HGHL. All data are shown as mean ± S.E. ** p < 0.01, *** p < 0.001 for all panels; n ≥ 3 independent experiments for each experimental condition or group.

