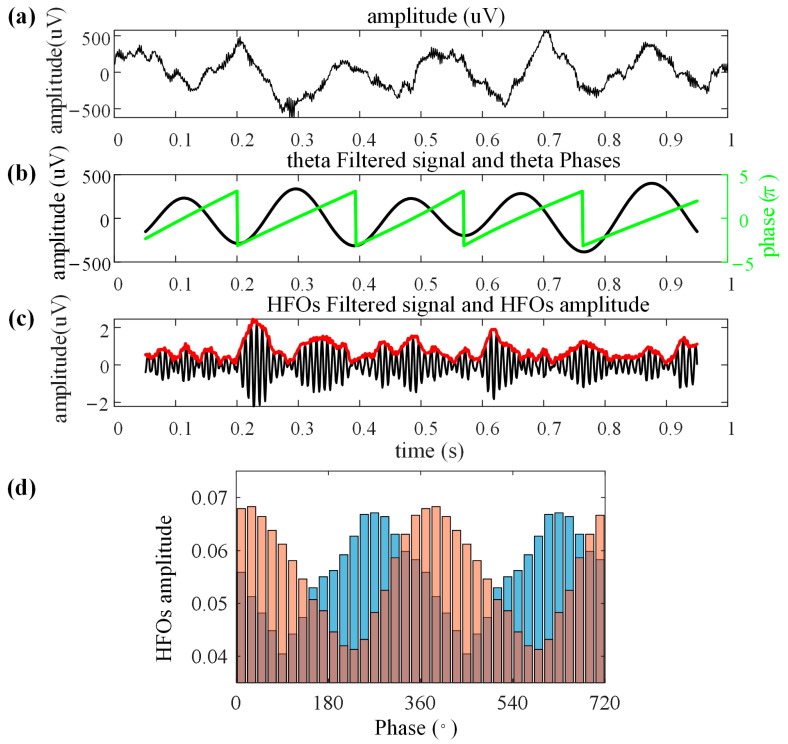
Figure 3.
Steps in the computation of phase–amplitude distribution. (a) Raw local field potential signals were recorded from the hippocampus of pigeon. (b) Filtered theta band (3–6 Hz) signals and extracted low-frequency phases. (c) Filtered high-frequency oscillations (HFOs) band (120–160 Hz) signals (black line) and HFO amplitude (red line). (d) Two amplitude distributions (blue bar, orange bar, and tawny bar indicated the area where the two distributions overlap) with different phase bins.

