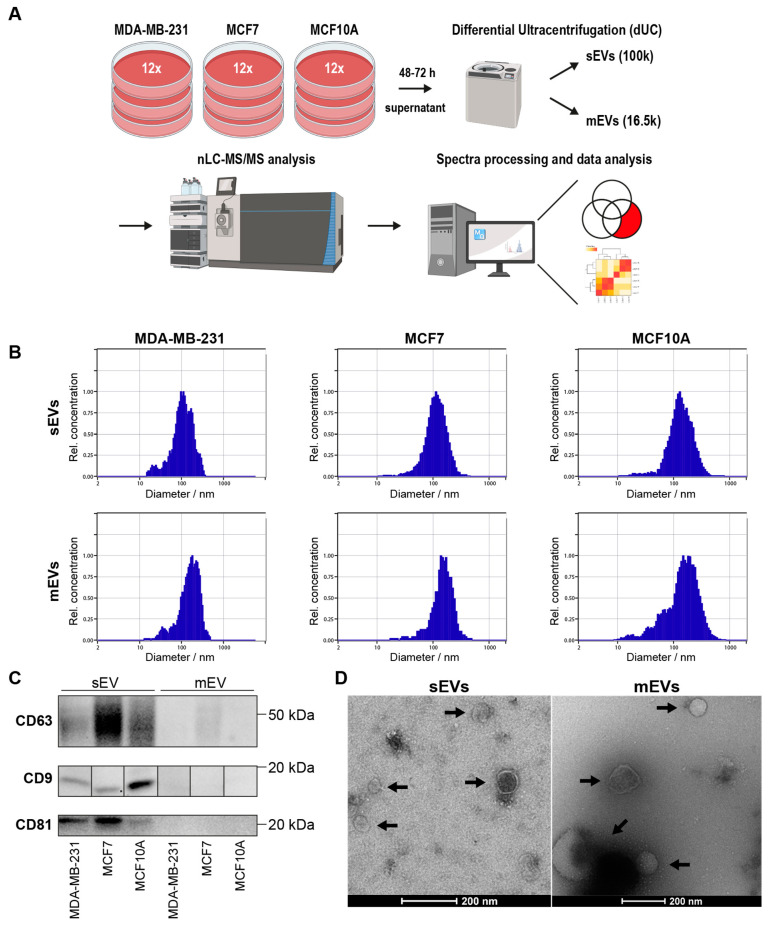
Figure 1.
Characterization of Evs isolated from cell culture supernatant by dUC. (A) Workflow for EV isolation from cell culture supernatant based on dUC. (B) Size distribution of isolated sEVs and mEVs obtained by NTA. (C) WB analysis of standard EV markers CD63, CD9, and CD81 (full images in Figure S2). (D) TEM images of isolated sEVs and mEVs from MDA-MB-231 cells. Black arrows indicate vesicles with an intact lipid bilayer membrane.

