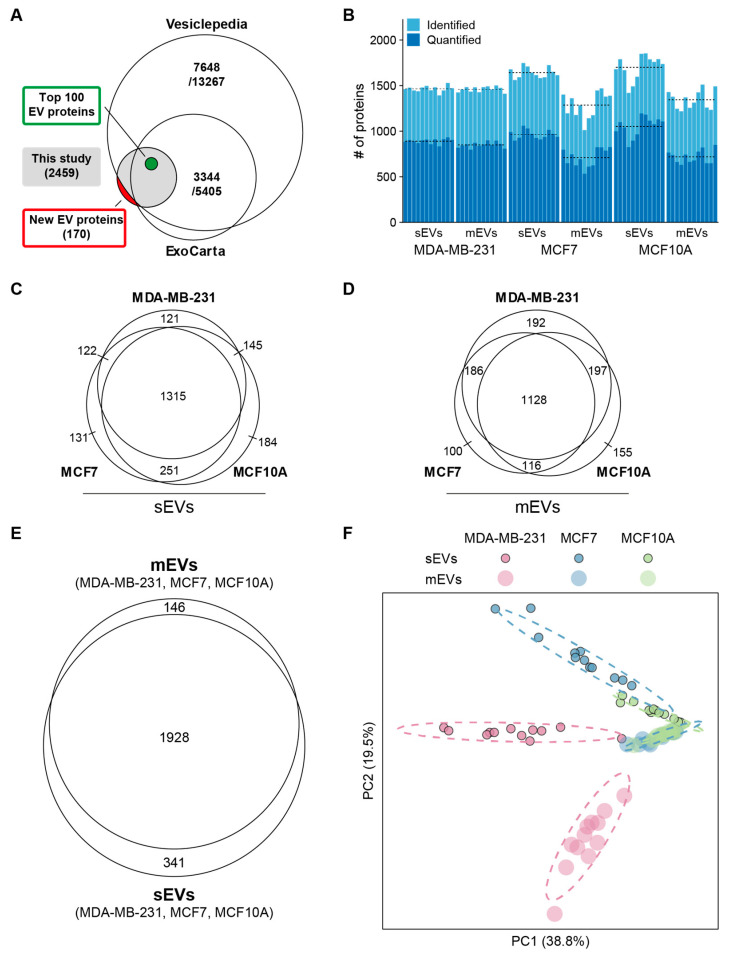
Figure 2.
Protein profiling overview. (A) Venn diagram representing number of previously identified EV proteins from EV databases. (B) Numbers of identified and quantified proteins in each replicate. Dashed lines indicate average numbers per group. (C) Overlap between identified proteins in sEVs. (D) Overlap between identified proteins in mEVs. (E) Number of identified proteins in sEVs and mEVs. (F) PCA plot based on scaled LFQ intensities. Dashed ellipses show the 95% confidence interval for each group.

