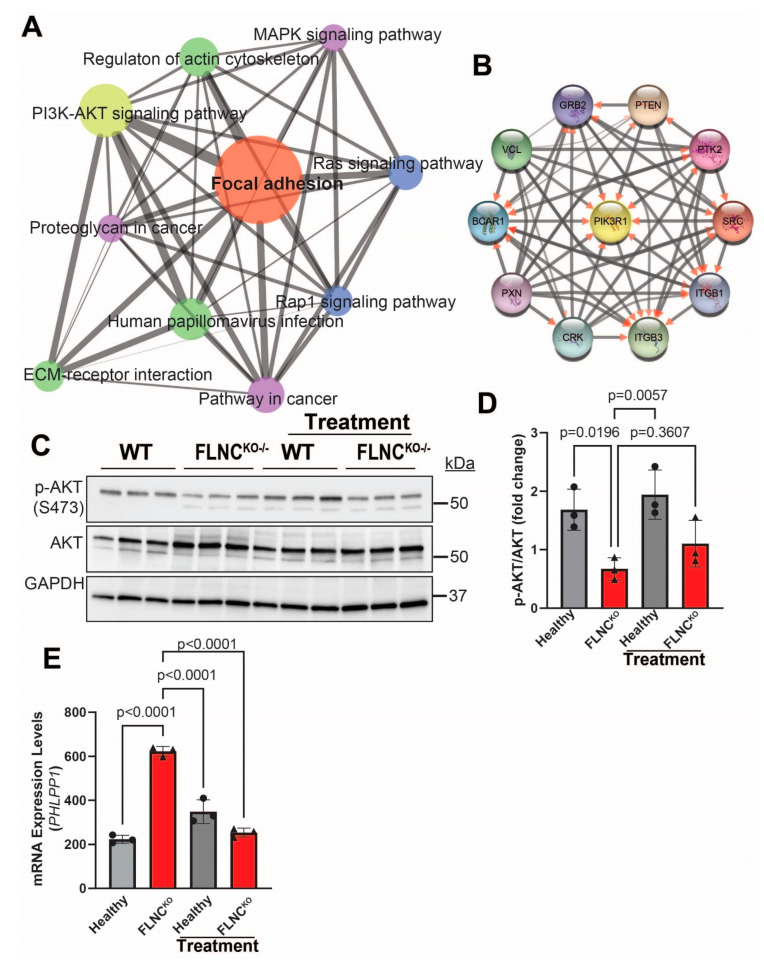
Figure 7.
Suppression of AKT signaling in FLNCKO iPSC-CMs. (A) Enrichment of PI3K-AKT signaling pathway, MAPK signaling (p = 3.09 × 10−80) pathway, and actin cytoskeleton DEGs in FLNCKO compared to isogenic control iPSC-CMs. (B) The molecular interaction network analysis revealed PIK3 kinase regulatory subunit 1 (PI3KR1) to be the core molecule. (C) Immunoblots showed decreased p-AKT expression levels in FLNCKO iPSC-CMs compared to isogenic control iPSC-CMs; total AKT expression levels were also significantly increased compared to isogenic control iPSC-CMs. (D) Quantitative representation of immunoblots in C. (E) PHLPP1 mRNA was increased in FLNCKO compared to healthy hiPSC-CMs, and treatment with crenolanib significantly downregulates PHLPP1 mRNA levels. All experiments were independently repeated three times.

