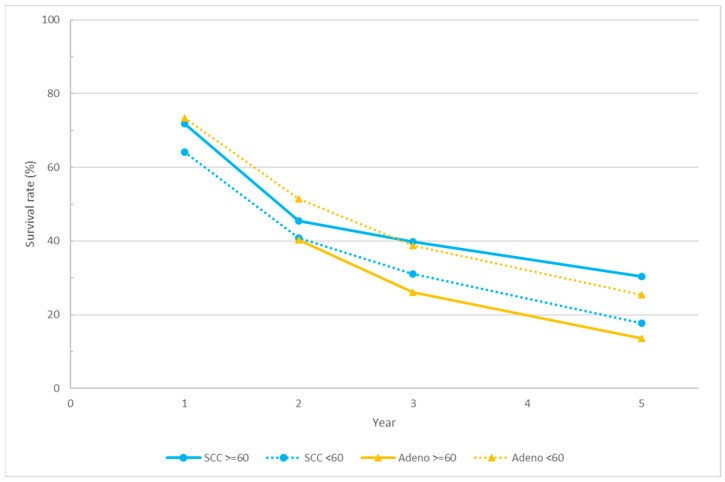
Figure 2.
This figure illustrates the relationship between radiation dose and overall survival, categorized by histology. The blue and light orange lines show the overall survival for squamous cell carcinoma (SCC) and adenocarcinoma (AC), respectively. Solid lines represent high radiation doses while dotted lines represent standard radiation doses.

