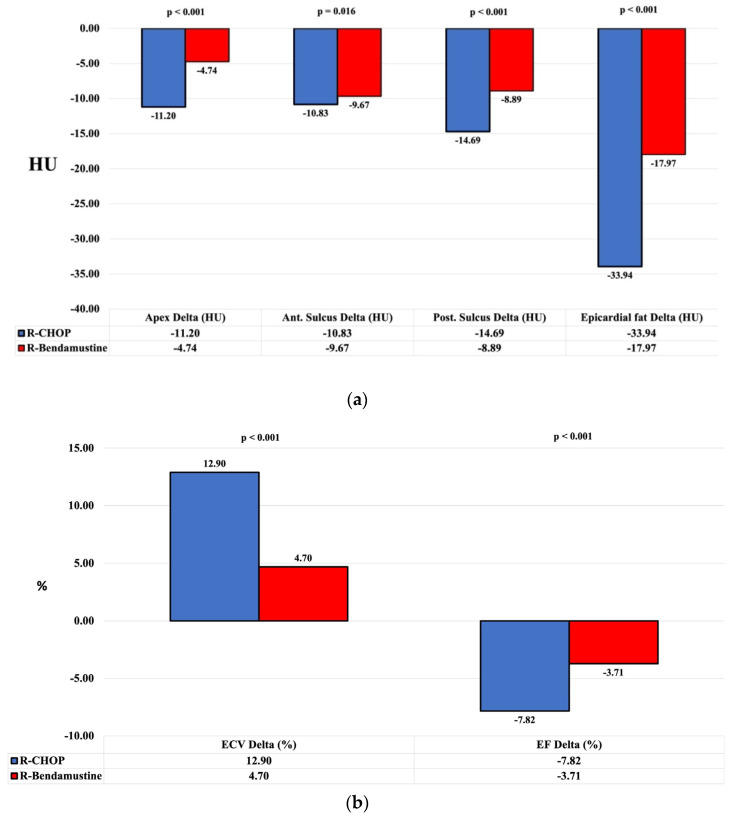
Figure 3.
Graphical representation of “delta” mean values stratified by R-CHOP vs. R-B. Pre- and post-treatment evaluation and the change in the parameters of EAT calculated at the level of the cardiac apex and the anterior and posterior interventricular sulcus and mean EAT (a), EF and ECV (b). In the R-CHOP group, there was a decrease in the density of EAT, an increase in ECV and a decrease in EF (p-value < 0.001). HU: Hounsfield units; ECV: myocardial extracellular volume; EF: ejection fraction.

