Figure 3.
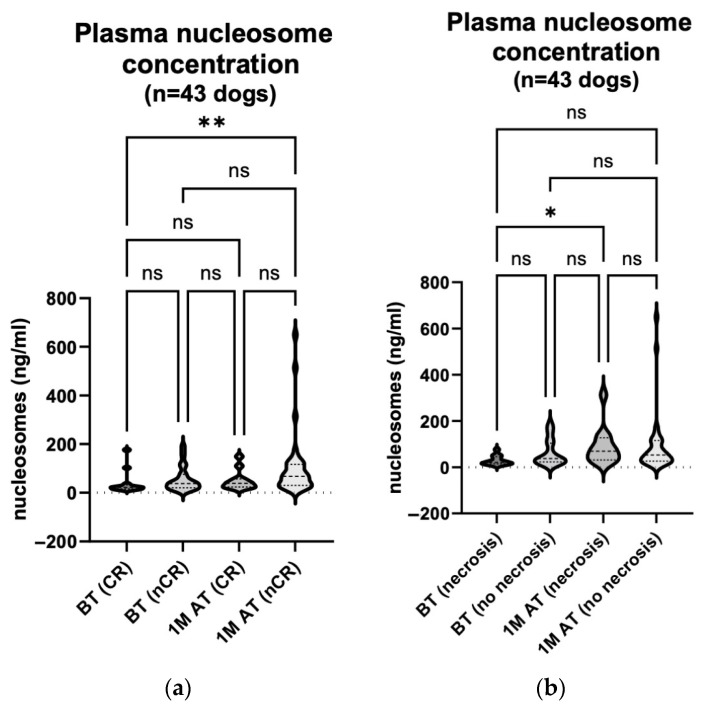
(a) Plasma nucleosome concentration comparison: pre-treatment and one month post treatment in correlation with response to treatment in 43 dogs. The concentration was measured using the Nu. Q® Vet Cancer Test on the day of treatment and four weeks later. The analysis showed no statistically remarkable changes in the plasma nucleosome concentration (p: BT (CR) vs. BT (nCR) = 0.624; BT (CR) vs. 1 M AT (CR) = 0.965; BT (CR) vs. 1 M AT (nCR) = 0.008; BT (nCR) vs. 1 M AT (CR) > 0.999; BT (nCR) vs. 1 M AT (nCR) = 0.195; 1 M AT (CR) vs. 1 M AT (nCR) = 0.741). BT, before treatment; 1 M AT, one month after treatment; CR, complete response; nCR, non-complete response (comprising of PR, SD, and PD); ns, not significant ** p < 0.01. (b) Plasma nucleosome concentration comparison: pre-treatment and one month post treatment in correlation with treatment-related enhanced tumour necrosis in 43 dogs. The concentration was measured using the Nu. Q® Vet Cancer Test on the day of treatment and four weeks later. The analysis showed a statistically remarkable rise in the plasma nucleosome concentration one month after treatment in patients where tumour necrosis was seen. BT, before treatment; 1 M AT, one month after treatment; ns, not significant (p: BT (necrosis) vs. BT (no necrosis) = 0.275; BT (necrosis) vs. 1 M AT (necrosis) = 0.030; BT (necrosis) vs. 1 M AT (no necrosis) = 0.055; BT (no necrosis) vs. 1 M AT (necrosis) > 0.999; BT (no necrosis) vs. 1 M AT (no necrosis) > 0.999; 1 M AT (necrosis) vs. 1 M AT (no necrosis) > 0.999); * p < 0.05.

