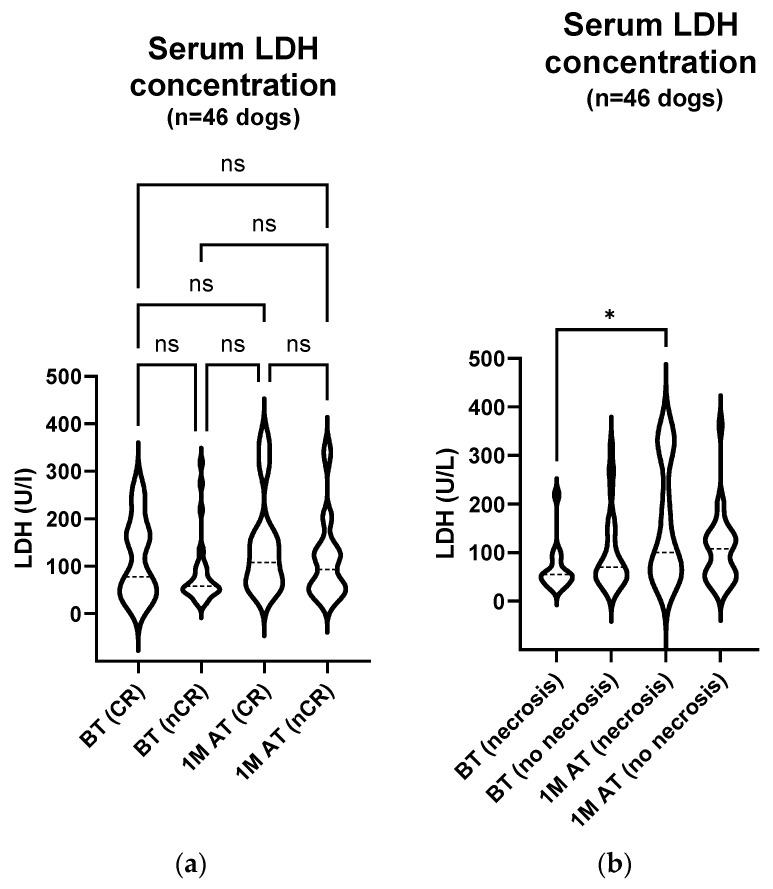
Figure 7.
(a) Serum LDH activity comparison: pre-treatment and one month post treatment in correlation with treatment response in 46 dogs. The enzyme activity was measured with an automated biochemical analyser on the day of treatment and four weeks later. The analysis showed no statistically remarkable changes in the serum LDH activity (p: BT (CR) vs. BT (nCR) > 0.999; BT (CR) vs. 1 M AT (CR) > 0.999; BT (CR) vs. 1 M AT (nCR) > 0.999; BT (nCR) vs. 1 M AT (CR) = 0.117; BT (nCR) vs. 1 M AT (nCR) = 0.370; 1 M AT (CR) vs. 1 M AT (nCR) > 0.999). BT, before treatment; 1 M AT, one month after treatment; CR, complete response; nCR, non–complete response (comprising of PR, SD, and PD); ns, not significant. (b) Serum LDH activity comparison: pre-treatment and one month post treatment in correlation with treatment-related enhanced tumour necrosis in 46 dogs. The enzyme activity was measured with an automated biochemical analyser on the day of treatment and four weeks later. The analyses showed a statistically significant increase in the serum LDH activity one month after treatment (p: BT (necrosis) vs. BT (no necrosis) > 0.999; BT (necrosis) vs. 1 M AT (necrosis) = 0.048; BT (necrosis) vs. 1 M AT (no necrosis) = 0.284; BT (no necrosis) vs. 1 M AT (necrosis) = 0.628; BT (no necrosis) vs. 1 M AT (no necrosis) > 0.999; 1 M AT (necrosis) vs. 1 M AT (no necrosis) > 0.999). BT, before treatment; 1 M AT, one month after treatment; * p < 0.05.

