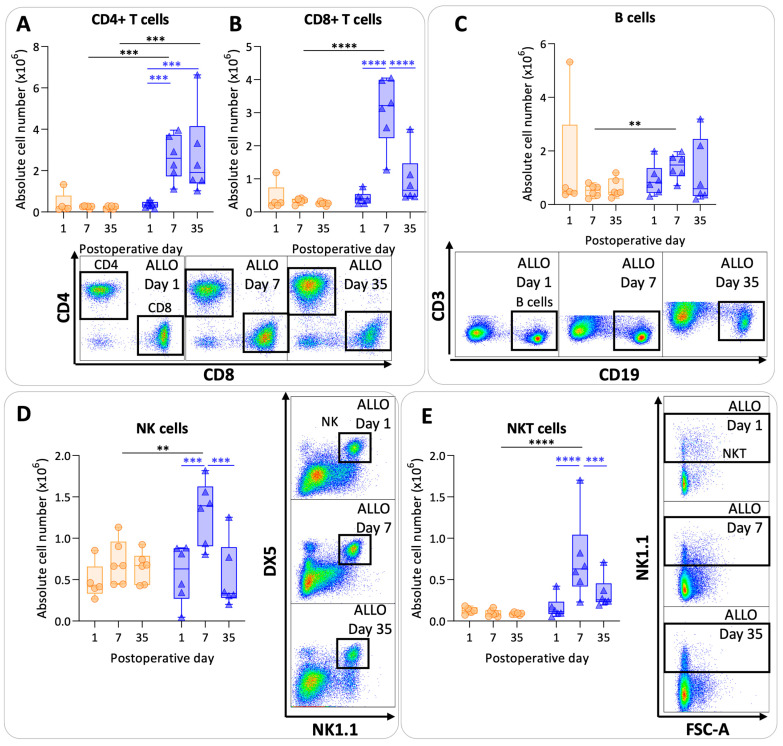
Figure 5.
Lymphoid pulmonary cells after murine lung transplantation. Isograft, depicted in orange, (C57BL/6 → C57BL/6) and allograft, depicted in blue, (BALB/c → C57BL/6) combinations were used at indicated days after transplantation. (A): Absolute numbers of adaptive immune cells including CD4+ T cells (CD45+ CD3+ NK1.1− CD4+). (B): CD8+ T cells (CD45+ CD3+ NK1.1− CD8+). (C): B cells (CD45+ CD3− NK1.1− B220+). (D): NK cells (CD45+ CD3− NK1.1+ DX5+). (E): NKT cells (CD45+ CD3+ NK1.1+). Data are shown as box-and-whisker plots (box: median with interquartile range, whiskers: full data distribution), with each data point representing an individual mouse sample. ** p ≤ 0.01; *** p ≤ 0.001; **** p < 0.0001. NK = natural killer.

