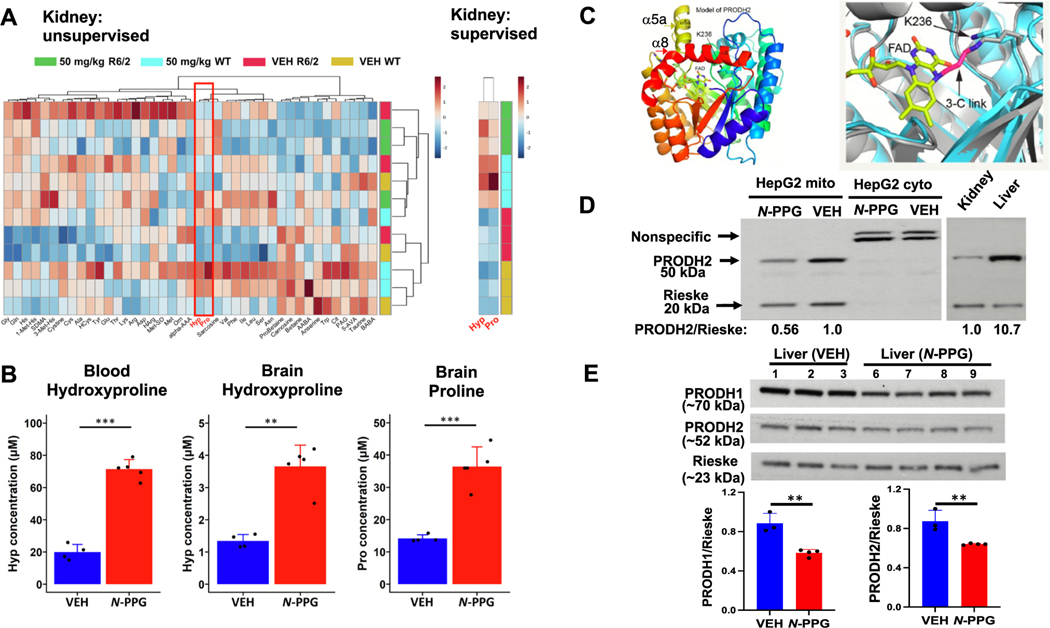
Fig. 1.
N-PPG targets HYPDH/PRODH2 modulating 4-hydroxyproline levels. a) Left, unsupervised clustering of 20 amino acids and 21 amino acids–related metabolites using kidney samples from N-PPG-treated (50 mg/kg) and vehicle-treated wild-type (WT) and R6/2 mice (N = 3 mice per group). Heatmap of metabolite levels using log10-transformed concentrations determined using the Biocrates MxP Quant 500 kit. Color scale bar represents z-score values after normalization. Red box highlights proline and 4-hydroxproline (Hyp) as the most differentially altered levels between N-PPG-treated and vehicle mice. Right, supervised clustering of hydroxyproline and proline also shows that these metabolites were up-regulated in N-PPG-treated vs vehicle-treated wild-type (WT) and R6/2 mice. Differences were significant for both hydroxyproline and proline, with a false-discovery rate (FDR) of 3.34 e-2 as determined using one-way ANOVA analysis and Fisher’s LSD post-hoc testing. Metabolites include β-aminobutyric acid, taurine, 5-aminovaleric acid, phenylacetylglycine, citrulline, Trp, anserine, α-aminobutyric acid, betaine, carnosine, proline betaine, Asn, Ser, Leu, Ile, Phe, Val, sarcosine, Pro, t-OH-pro, α-aminoadipic acid, ornithine, Met, methionine sulfoxide, homoarginine, Asp, Arg, Lys, Thr, Glu, Tyr, homocysteine, Ala, Cys, Cystine, 3-methylhistidine, symmetric dimethylarginine, 1-methylhistidine, His, Gln, and Gly. The ultra-performance liquid chromatography–tandem mass spectrometry (UPLC-MS/MS) output data were imported into Skyline-daily for peak integration, calibration, and concentration calculations [17]. Exported data from Skyline were processed using a custom visual basic macro for importing into MetIDQ software (Biocrates AG) and MetaboAnalyst 5.0 [18].
b) Metabolomic analysis comparing blood and whole brains from R6/2 mice treated for 14 days with 50 mg/kg N-PPG or vehicle (VEH) as in panel a. Bar plots display the averaged metabolite concentration obtained in N-PPG-treated mice (N = 5) and VEH-treated mice (N = 4). For blood, only 4-hydroxyproline was significantly up-regulated upon N-PPG treatment, while in brain lysates, both proline and hydroxyproline were significantly up-regulated. Statistical analysis was performed using two-sample t-test followed by p-value correction for multiple testing. *FDR ≤ 0.05, ** FDR ≤ 0.01, *** FDR ≤ 0.001. The error bars correspond to the standard deviation. Metabolite concentrations are expressed in μM. c) To determine if the predicted active site structure of HYPDH/PRODH2 is consistent with the covalent inactivation mechanism of N-PPG, the AlphaFold model of HYPDH/PRODH2 was superimposed onto the crystal structure of an N-PPG inactivated PutA PRODH domain [19]. This modeling showed that HYPDH/PRODH2 is predicted to have a structure needed for both binding of N-PPG in the substrate pocket and subsequent mechanistic steps (bond breaking and formation), leading to covalent linking of the FAD N5 atom to ε-amino group of the conserved active site lysine (Lys236 in HYPDH/PRODH2) [8,20]. HYPDH/PRODH2 molecular structure accommodates N-PPG binding and inhibition. Structural model of HYPDH/PRODH2 from AlphaFold2 viewed looking down the enzymatic (βα)8 barrel structure using a rainbow coloring scheme with blue at the N-terminus and red at the C-terminus. The N-PPG covalently interacting elements FAD (yellow) and Lys236 are noted. Two unique α-helices, α8 (red) and α5a (yellow), distinguish the HYPDH/PRODH2 barrel from other (βα)8 barrel proteins. Superposition of the HYPDH/PRODH2 model (cyan) with the crystal structure of an N-PPG-inactivated bacterial PRODH (PDB ID 5UR2, gray) showing that Lys236 has the potential for covalent linkage to the FAD upon inactivation by N-PPG with N-PPG’s 3 carbon link (3-C link) between the bacterial PRODH’s FAD and lysine shown in red. d) Western blot probed with HYPDH/PRODH2 and Rieske (for normalization) of mitochondria (mito) and cytoplasmic (cyto) fractions from HepG2 cells treated for 48 h with 5 mM N-PPG (+N-PPG) or untreated. Arrows indicate HYPDH/PRODH2 and Rieske bands. Non-specific bands are seen only in the cytoplasmic fraction that contains no signal from the mitochondrial HYPDH/PRODH2 (left). Western blot using mouse WT lysates from whole kidney and whole liver probed for Hypdh/Prodh2 with normalization to Rieske (right). e) Western blot of whole-liver lysates probed for Prodh1 and Hypdh/Prodh2 with Rieske normalization. Quantification of the Prodh1 and Hypdh/Prodh2 levels normalized to Rieske are shown in the lower panel. **, p = 0.0025 and 0.0076 for Prodh1 and Hypdh/Prodh2, respectively.

