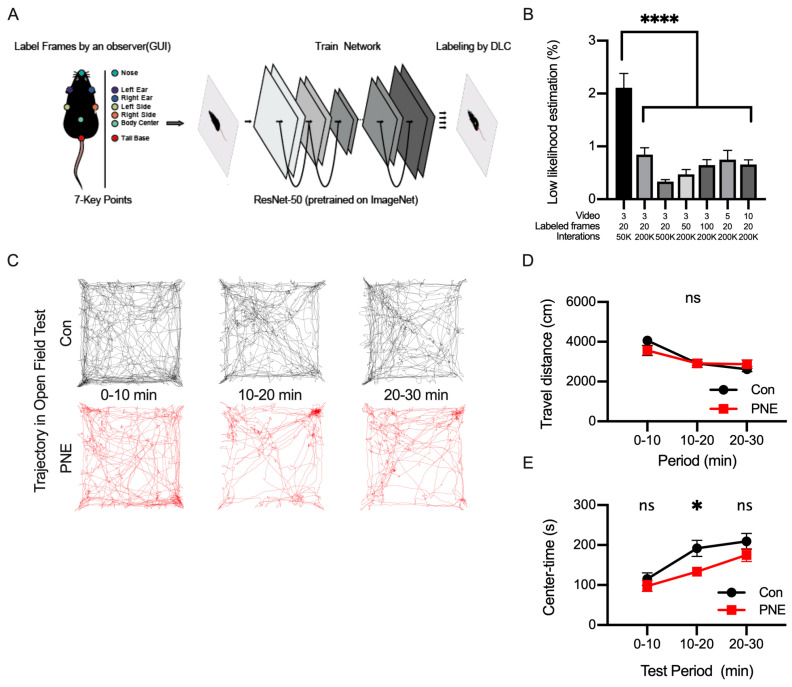
Figure 3.
Labeling body parts of a single mouse using DeepLabCut and tracking the trajectory of the freely moving mouse. (A): DeepLabCut was used to label seven key points of the mouse during the open-field test, consisting of the nose (green), the left ear (purple), the right ear (blue), the left side of the trunk (grey), the right side of the trunk (orange), the body center (light green), and the base of the tail (red). These points were labeled by a human experimenter (training data) and the network was trained using the training data. (B): the graph shows the percentage of mislabeled frames in the video proceeded by different parameters to construct a network in DeepLabCut (F(6,28) = 16.09, p < 0.001). (C): the position of the mouse was estimated as the center of mass of the total parts of the mouse body labeled by DeepLabCut, and the trajectory of the mouse is shown. The trajectory of the control (black, n = 12) and PNE (red, n = 12) mice every 10 min is shown. (D): the travel distance of the control and PNE mice was not different in all the periods (0–10 min: t(22) = 1.44, p > 0.1; 10–20 min: t(22) = 0.03, p > 0.1; 20–30 min: t(22) = 1.01, p > 0.1). (E): the length of time during which the mice stayed in the center part of the open-field arena is shown. Control mice stayed in the center part longer during the 10-to-20 min period (0–10 min: t(22) = 0.85, p > 0.1; 10–20 min: t(22) = 2.61, p < 0.05; 20–30 min: t(22) = 1.34, p > 0.1), indicating that the control mice became accustomed sooner than PNE mice. ns = not statistically significant, * p < 0.05 and **** p < 0.0001 determined by using Student’s t-test.

