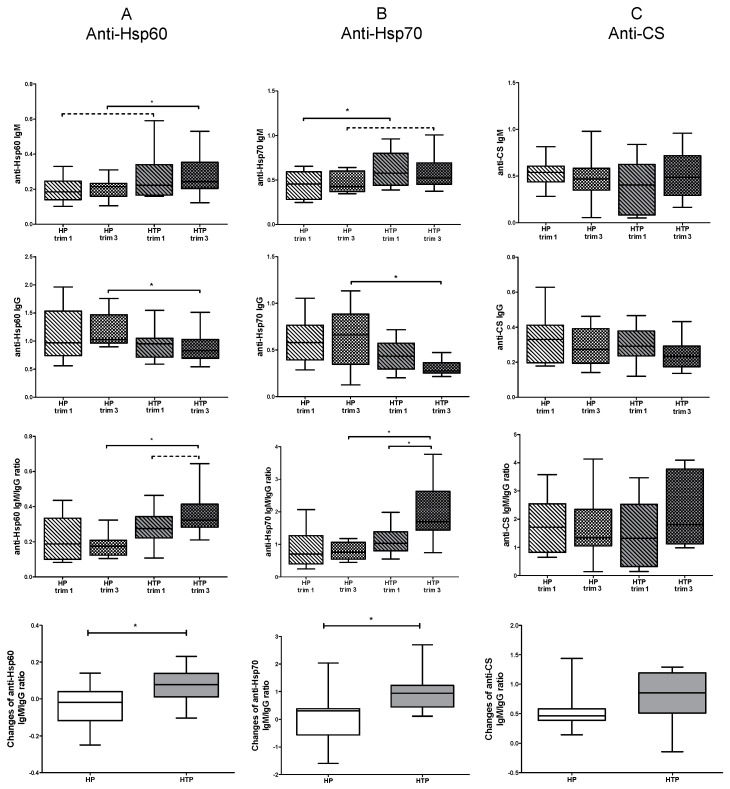
Figure 2.
Levels of nAAbs in the first and third trimesters of healthy (HP) and Hashimoto’s thyroiditis pregnant (HTP) women. Levels of anti-Hsp60 IgM and IgG, IgM/IgG ratios, and changes in IgM/IgG ratios (A); levels of anti-Hsp70 IgM and IgG, IgM/IgG ratios, and changes in IgM/IgG ratios (B); and levels of anti-CS IgM and IgG, IgM/IgG ratios, and changes in IgM/IgG ratios (C). Boxes show interquartile ranges (IQRs), horizontal lines represent medians, and whiskers indicate the lowest and highest values. n(HP) = 14, n(HTP) = 14 * p < 0.05.

