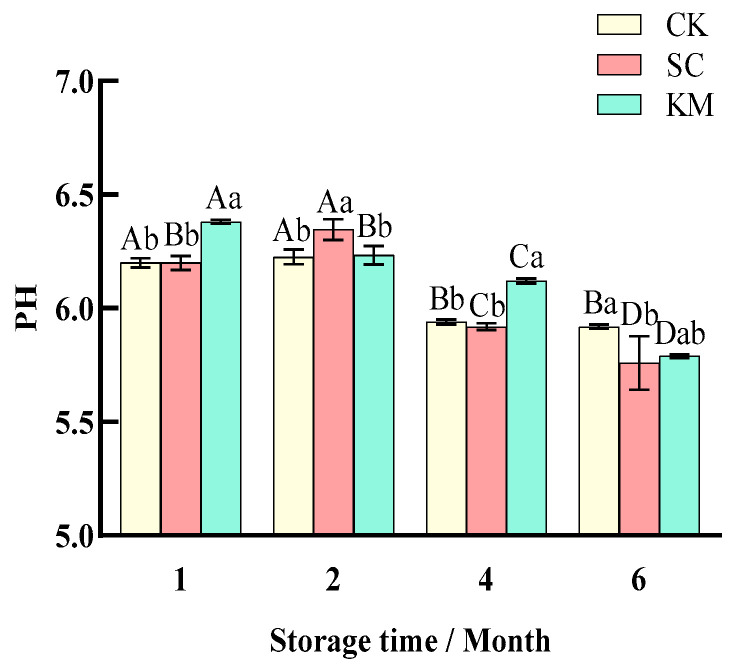
Figure 3.
pH changes in sauce meat during storage with the addition of different yeasts. A control group without added yeast (CK), a group with S. cerevisiae added at 0.3% of the mass of the raw meat (SC), and a group with K. marxianus added at 0.3% of the mass of the raw meat (KM). Note: capital letters represent the difference between the same groups at different times (p < 0.05), and small letters represent the difference between the groups at the same time (p < 0.05).

