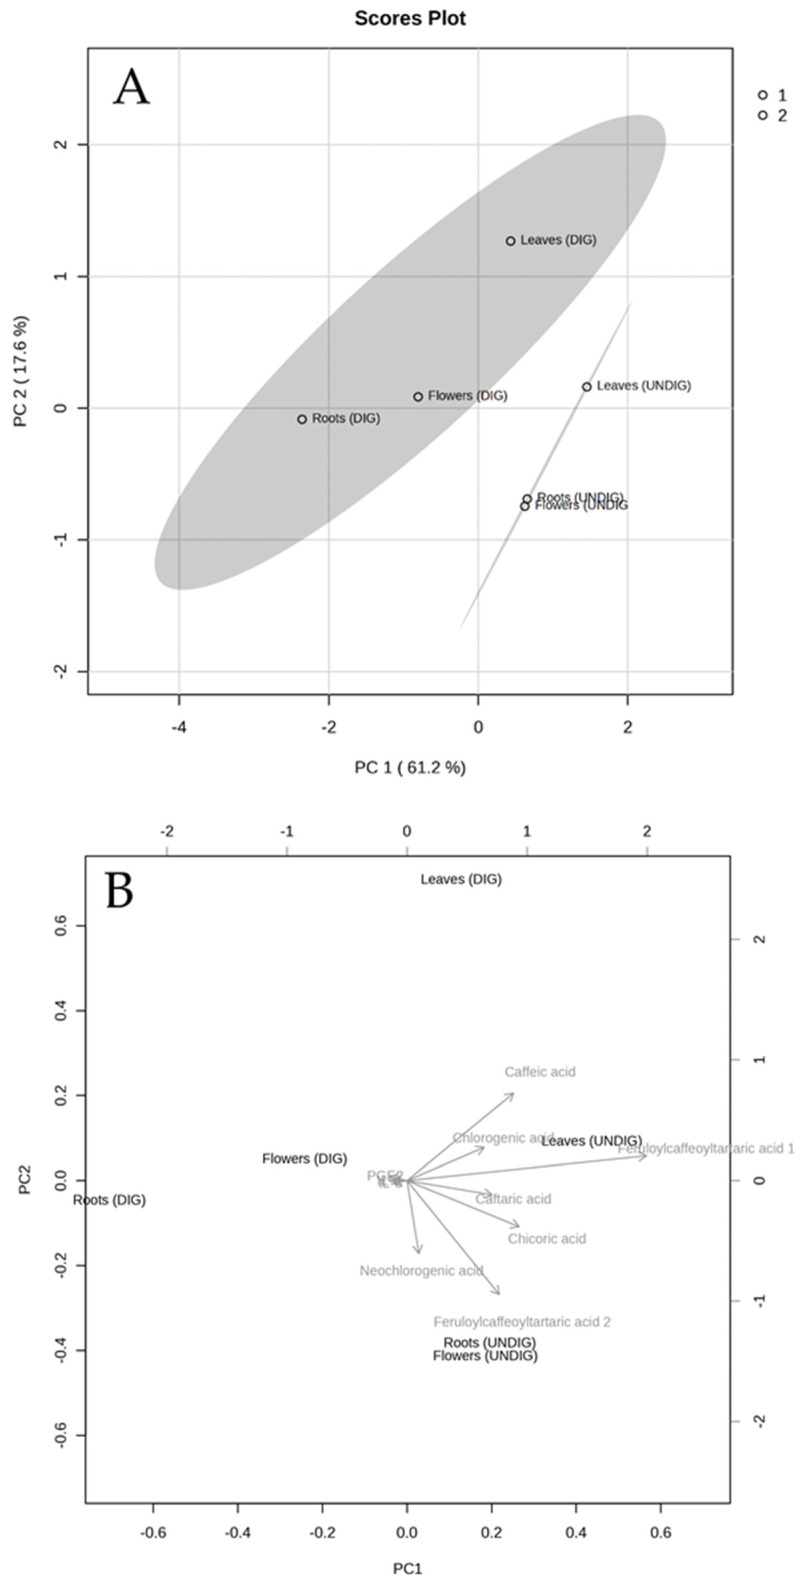
Figure 4.
Principal component analysis (PCA) (A) of the EP leaves, flowers, and root extracts before (UNDIG) and after digestion (DIG) (phenolic compounds and pro-inflammatory markers). The biplot (B) displays the interplay between EP samples and phenolics and pro-inflammatory markers (denoted by arrows) in a two-dimensional space.

