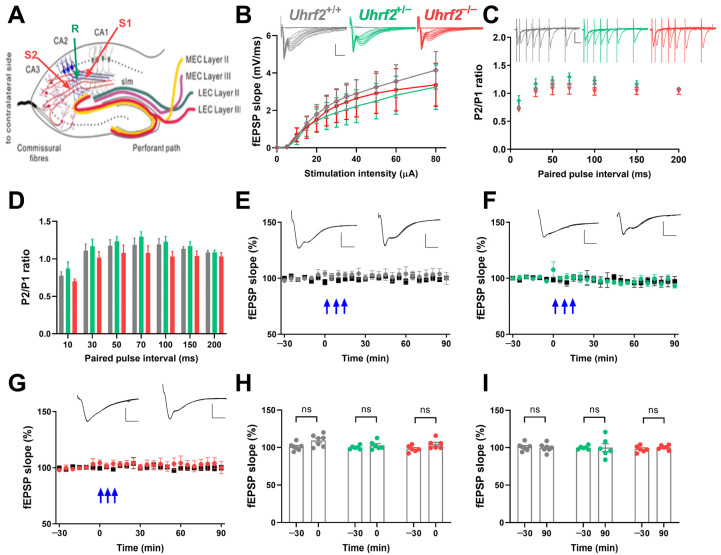
Figure 5.
Uhrf2 knockout does not affect input–output characteristics, paired-pulse facilitation, and synaptic plasticity in the SC-CA2 pathway. (A) This is a schematic diagram that illustrates the placement of electrodes in the SC-CA2 region. (B) Input–output curves were generated for the SC-CA2 synaptic transmission in Uhrf2+/+ (gray, n = 7), Uhrf2+/− (green, n = 6), and Uhrf2−/− mice (red, n = 7). fEPSP sample traces were presented with scale bars indicating an amplitude of 2 mV and a time interval of 5 ms. Statistical analysis using a two-way RM ANOVA revealed no significant differences in input–output curves among the different groups of mice (F (2, 17) = 0.13, p = 0.88). Post hoc comparisons using Sidak’s test also did not show any significant differences between groups per stimulation intensity (all p-values > 0.7). (C) Paired pulse facilitation fEPSP traces and ratios of P2/P1 fEPSP slopes were recorded for Uhrf2+/+ (gray, n = 8), Uhrf2+/− (green, n = 6), and Uhrf2−/− (red, n = 7) mice. Scale bars are 1 mV/10 ms. (D) No significant differences in paired-pulse facilitation were observed between Uhrf2+/+, Uhrf2+/−, and Uhrf2−/− mice (two-way RM ANOVA: F (2, 18) = 1.78, p = 0.12). Post hoc group comparisons per stimulus interval also revealed no significant differences (all p-values > 0.1). (E) LTP induction was observed in wild-type Uhrf2+/+ mice (gray, n = 7) following three tetanic stimulations (3 × 100 Hz, indicated by blue arrows). (F) LTP induction was performed in Uhrf2+/− mice (green, n = 6) after three tetanic stimulations. (G) LTP induction was also performed in Uhrf2−/− mice (red, n = 6). (H) No detectable effect of genotype on fEPSP slope potentiation immediately after tetanization was observed in Uhrf2+/+, Uhrf2+/−, and Uhrf2−/− mice (two-way RM ANOVA: F (2, 16) = 2.29, p = 0.14). Post hoc comparisons showed a significant difference between baseline and time 0 in wild-type mice (p = 0.044), while no significant differences were detectable in heterozygous and homozygous mice. (I) At the 90 min time point, there was no genotype effect on fEPSPs compared to baseline in Uhrf2+/+, Uhrf2+/−, and Uhrf2−/− mice (two-way RM ANOVA: F (2, 16) = 0.12, p = 0.89). Post hoc comparisons also showed no significant differences between baseline and 90 min time points for any group (all p-values > 0.9). Representative fEPSP traces at −30 and 90 min are shown with 2 mV/5 ms scale bars.

