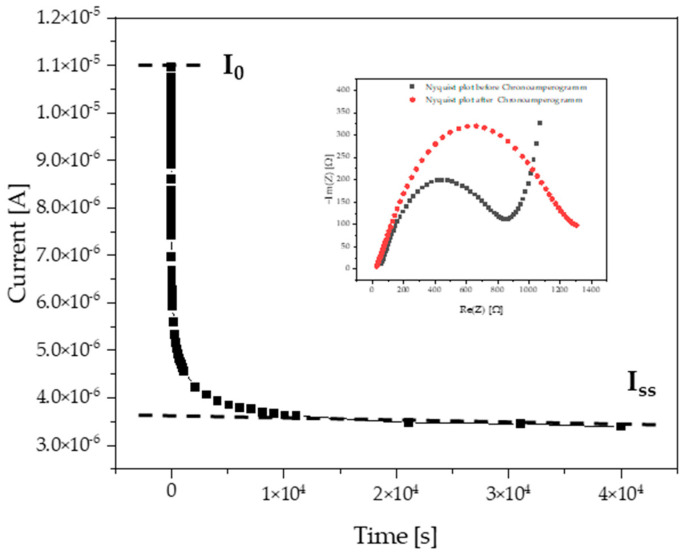
Figure 3.
Chronoamperogram of the PPC/PIL-10/LiTFSI membrane at a 1/1/0.6 wt/wt/wt ratio recorded at an applied voltage of 10 mV (I0—the initial current, Iss—steady state current). The inset is the corresponding Nyquist plots before (black color) and after (red color) polarization chronoamperometry measurements. The experiments were performed at 60 °C.

