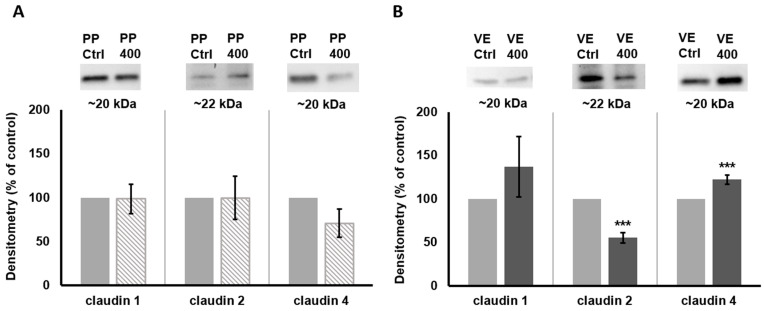
Figure 3.
Quantitative protein analysis: Western blots and densitometry of claudins detected in (A) PPs and (B) VE tissue samples after 4 h incubation with 400 µM quercetin compared to controls. The level of claudin 1 was not influenced by quercetin in both tissue types. For claudin 2, we observed a reduced protein level in the VE (p < 0.001) whereas claudin 4 was increased (p = 0.001). Values are given as mean ± SEM and asterisks indicate significant differences, *** = p ≤ 0.001; protein level is shown as the percentage of controls, set to 100%.

