Figure 1.
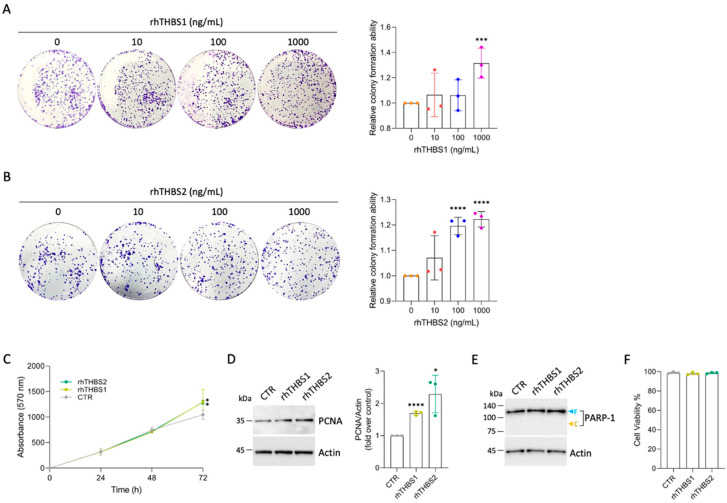
rhTHBS1 and rhTHBS2 increase colony formation in CCLP1 cell line. Clonogenic assays performed with CCLP1 cells in the presence of rhTHBS1 (A) and rhTHBS2 (B) at the indicated concentrations. (C) Time course of CCLP1 cell growth assessed using the MTT cell viability assay at various time points in the presence of 1000 ng/mL of rhTHBS1 and rhTHBS2. (D) Western blot analysis for PCNA on whole-cell extracts of CCLP1 cells cultured in the presence of 1000 ng/mL of rhTHBS1 and rhTHBS2 for 48 h; actin was used as a loading control. Quantification from three independent immunoblots by densitometry analysis is shown. (E) Western blot analysis for PARP-1 on whole-cell extracts of CCLP1 cells cultured in the presence of 1000 ng/mL of rhTHBS1 and rhTHBS2 for 48 h. Arrows indicate the expected molecular weights for the full-length (blue) and cleaved (yellow) forms; actin was used as a loading control. (F) Determination of cell viability after treating CCLP1 cells with 1000 ng/mL of rhTHBS1 and rhTHBS2. The cell viability was measured after 8 h by the intake of trypan blue by dead cells; * p < 0.05; *** p < 0.001, **** p < 0.0001 (t-test).

