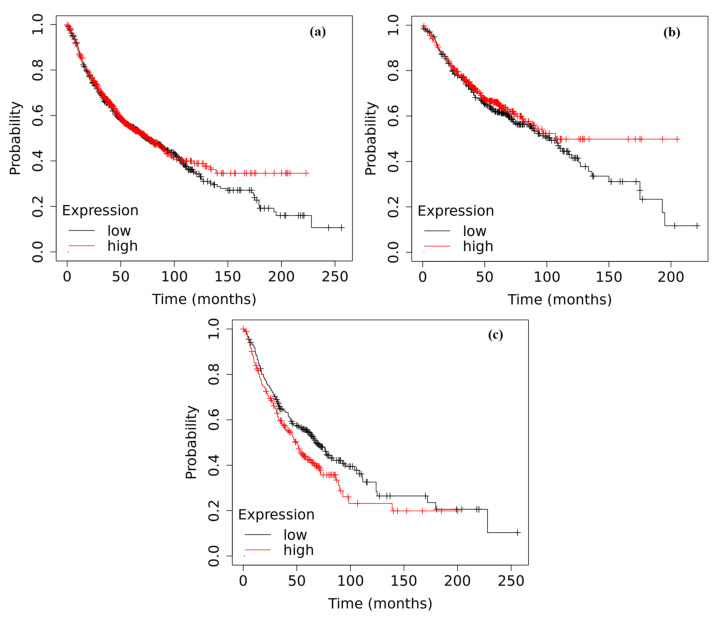
Figure 5.
Kaplan–Meier curves depicting the survival analysis of NSCLC patients based on the expression of the ADAMTS6 gene in tumor tissue: (a) Patients without histopathological subtype division (p = 0.4622); (b) Adenocarcinoma (p = 0.2618); (c) Squamous cell carcinoma (p = 0.0224). The analysis was performed based on data collected in the Kaplan–Meier plotter database.

