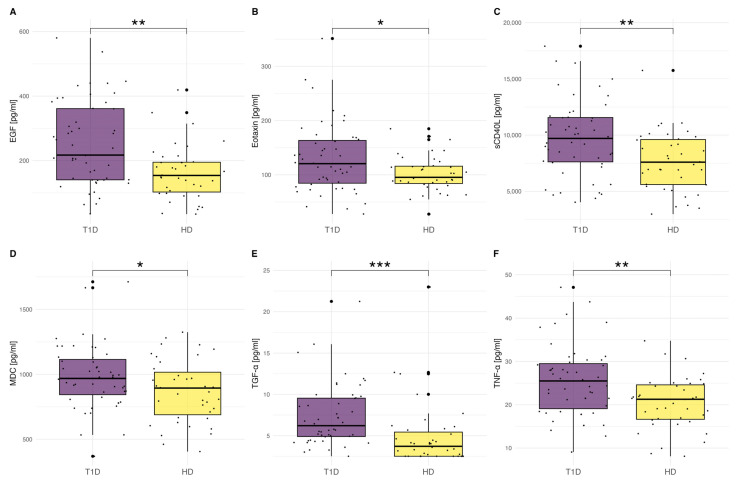
Figure 2.
(A–F) The comparison of cytokines, chemokines, and growth factor levels between the T1D patients (n = 51) and the control group (n = 39). The significance was calculated using ANOVA with subsequent post-hoc analysis of contrasts. In the case of the TGF-α level, the Kruskal–Wallis test with post-hoc Wilcoxon test was used due to the lack of normal distribution of variables. Significant results are marked with * (p < 0.05), ** (p < 0.01), or *** (p < 0.001). Dots show the distribution of data.

